


Unilever India - A Story To Find Missing Growth.
A fundamental analysis of Hindustan Unilever

Hello Guys 👋,
This post is to understand how to value an FMCG company.
The company I have chosen for this case study is Unilever.
Note: This is not a stock recommendation. I am not a registered analyst. This study is purely done from a learning perspective. Such detailed analysis is missing on the internet for people who really want to learn the art of valuing companies by themselves.
Let’s begin.
In the year 2010, I had an opportunity to do my internship at Unilever, India.
I remember the first day very vividly. It was a Mumbai summer.
I and a friend of mine had taken a bus from IIT Bombay's main gate to Unilever’s HQ. We both were interning at Unilever. Instead of going through the main gate of Unilever, we took the side gate that opened into an old building. (I believe it was the old HQ before the new HQ was built)
We got into the building and met the HR. He was a kind gentleman, in his 50s I guess. He informed us that we would be working with a senior from IIT Bombay and were informed that our stipend would be Rs 8000 per month.
We were elated.
Getting Rs 8000 per month and working with a senior from the same college — what more would we want!!
Haha. Sigh! Good Old days.
Our manager i.e. senior from college was a smart guy. He later went to do his MBA from Wharton and I believe works for McKinsey now. We loved working with him and the Unilever team.
Once my internship was over, I used to tell my friends that one day I would work for Unilever.
Haha.
That day never happened, but I always had pleasant memories of my time there.
Unilever, according to me, was/is one of the best places to work. The people, the culture and the work felt amazing to me.
Anyway, this was 2010. I went on a completely different path once I graduated.
I have no regrets.
In my startup journey, I made new friends and worked with a few extremely smart, hard-working and driven people.
I will always be extremely grateful to them.
Moving on, Let us try to evaluate Unilever now.
Step 1: Understand the business
Unilever is a giant in the FMCG space. The behemoth owns a majority share in the Indian consumer space and its branding is one of the finest.
I don’t think there can be a household in India that does not use an Unilever product. Be it face wash, cookies or detergent, Unilever makes everything.
Now, the question that would come to your head would be how can we value this behemoth.
We will use the most straightforward approach, i.e. the value of any business/asset is the summation of all the expected cashflows the business will generate in its lifetime divided by a discount factor called cost of capital(r). The equation will look something like this:
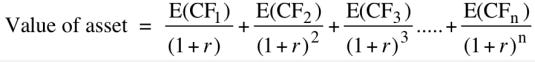
E(CF)s are expected cashflow of the business in year 1, year 2, … till the nth year.
“r” here is the discount factor or cost of capital. If we have both these ingredients, we can quickly value any asset.
According to this report, India’s FMCG market is expected to grow from USD 110 Billion in 2020 to USD 220 Billion by 2025, with an annual growth rate of 14.9%. Freezing the USD/INR exchange rate at 73 (which was the rate in 2020 — since the report takes 2020 as base year ), we get the following picture:
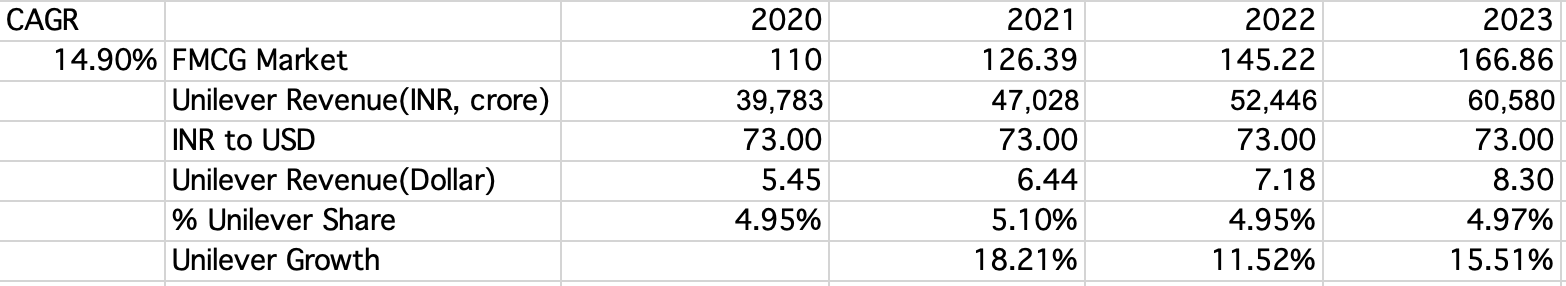
Unilever did grow its revenue close to the CAGR rate of 14.9% for the years 2021-2023, however, the trailing 12 months’ revenue for Unilever is at Rs 61,901 crore, a meagre 3% growth over the last FY base of Rs 60,580 crore.
Its market share (at least based on the numbers in the report) is around 5% mark.
Every quarter, all companies host a conference call called “Earnings call”. We would need to read the transcript of Unilever’s call to understand why the growth fell so much.
I went through the latest call and understood the following:
Rural consumer sentiment remains subdued, urban growth outpacing rural
Unilever experienced negative price growth in certain divisions, such as Home Care and Beauty & Personal Care, due to price cuts in commodity-linked categories to pass on the benefits of lower material prices to consumers.
This resulted in flat underlying sales growth and posed challenges in maintaining positive pricing amidst market dynamics.
While the company saw volume recovery in segments like Home Care and Beauty & Personal Care, the Foods & Refreshment segment faced challenges with low single-digit volume declines.
Factors like tea downgrades, price increases in coffee, and commodity inflation in coffee impacted volume growth in this segment, highlighting the complexities in balancing pricing strategies with volume growth initiatives
Outlook for gradual recovery in market demand
Taking all into consideration—positive outlook for growth demand and the CAGR mentioned in the report, Unilever could recover its lost growth in the coming years. (The report stated ~15% growth rate only till 2025. Post that the growth would still be there but less than or equal to Indian economy’s growth rate).
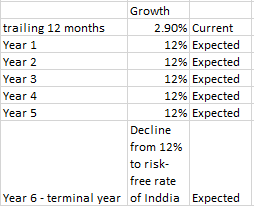
I will consider a 10-year window for our valuation.
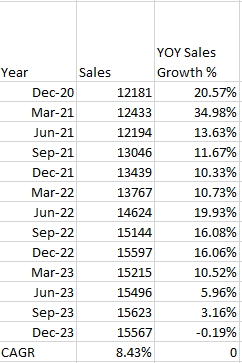
Considering the story so far, I will assume that next year Unilever will deliver a higher revenue jump (12%) - considering a muted growth this year. It will then be able to maintain it at 12% from 2nd to 5th year too. Its historical growth rate was as follows:
The assumption of 12% growth rate for next few years is not completely a whacky one.
From the 5th year till 10 year, I will assume that the company slowly moves from 12% to 6.40% i.e. Indian 10 year risk-free rate. (For a quick high level understanding what are risk-free rate and risk premium in 3 mins—read my old post here)
This would be my rough plan of actions:
Step 2: Calculate the discount rate
As discussed above, discount rate is the factor with which we will be dividing the expected cashflow for the year.
We shall be using the most famous discount factor calculation model called the CAPM model.
The CAPM theory aka capital asset pricing model theory fetched a Nobel Prize for William Sharpe for his contribution. So you get the point, why it is so famous.
CAPM model says that the cost of capital or discount factor(r) in our case is:
risk-free rate + beta x Equity Risk PremiumIt is relatively simple to calculate risk-free rates for any country. For US, the risk-free rate is the yield on 10 year treasury bond (since we are considering a 10-year window for our calculation, we consider 10Y treasury bond).
The current 10 Y Treasury Bond is trading at a yield of 4.2%.
Beta is defined as the relative riskiness of the firm in consideration to the overall market. A simple way to calculate it would be to take the weekly returns of the company for 2-year period and compare it to the weekly return of an index (say S&P 500).
If you plot a graph between the returns and fit a straight line in an Excel sheet, the slope of the straight line would be the beta.
This is called regression beta and is extremely noisy. The standard deviation in this beta would be too high.
This regression beta is also a function of debt in the firm. If the firm has really high debt, the beta for the firm would be higher since it is riskier than the market.
To handle this problem, we will use an Unlevered Beta (Regression betas are levered beta. The word “levered” means that debt is involved). The Unlevered beta for the “Household products” industry in India is 0.69. (You can get the value from here).
We will convert the Unlevered Beta to Levered Beta now.
The relation is as follows:
Levered beta = Unlevered Beta x ( 1 + (1-tax rate) x Debt/Equity)India’s tax rate is 25%. Market value of Debt for Unilever is Rs 1237 crore and market value of Equity is Rs 528,515 crore. Their ratio is negligible, making Unlevered beta equal to levered beta.
Now, the only thing remaining in CAPM is Equity Risk Premium(ERP).
To get ERP, We can refer to this sheet and check ERP for India. The value comes out to be 7.81%.
So,
4.20% +0.69x7.81% = 9.58%Now, here we have used US 10 Y bond rate and the 7.81% is ERP for India in $ terms. Since we are doing valuation in Indian Rupee, we need to convert this cost of capital 9.58% to Rupee term.
To do that, we need to get expected inflation in the US and expected inflation in India and scale the value.
Getting US expected inflation is easy. Since we know the 10Y bond yield is 4.2%. We just need to subtract the TIPS (Treasury Inflation-Protected Securities) rate.
TIPS is a government bond which assures the buyer a guaranteed inflation adjusted returns. If TIPS rate is 2% and inflation is 3%, the buyer will get 5% return. That is how it works.
The current TIPS rate is 1.975%.
Expected Inflation in US = 4.20% - 1.975% = 2.225%Unlike US, we don’t have TIPS equivalent in India. The expected inflation in 2028 as per statista is 4%. Let us proceed with that for our calculation.
Cost of Capital (Rupee term) = (1+ 9.58%) x (1 + 4%)/(1+2.225%) -1 = 11.48%We will consider this to be the Cost of capital for all years till the terminal year. For the terminal year, we will consider mature market premium (Take US ERP from sheet) and add it to US risk-free rate with beta as 0.67 (since we don’t expect in future that Unilever will deviate from its FMCG segment). This gives us the cost of capital in terminal year as:
Terminal Cost of capital ($ term) = 4.02% + 0.69 x 4.5% = 7.305%Cost of Capital (Rupee term, terminal year) = (1+ 7.305%) x (1 + 4%)/(1+2.225%) -1 = 9.16%Step 3: Calculate the cash flows to the firm
Operating Profit(income) = Revenue - Operating expenses.
Operating Profit / Revenue is Operating Profit Margin (OPM).
However, Unilever is expensing all its branding expenses, and I want to capitalize it.
What does capitalization mean?
I wish to create an asset on balance sheet for the advertisement and promotion. The logic is the following:
Any branding and promotion activity which Unilever does will have effect not only in the current year but also in the coming years.
I am sure you guys would remember DOVE advertisement. Now, the ad might have been created long time ago, still the branding exists in our mind through their creative advertisements.
To do that, I did the following:
I assumed that all the advertisement and promotion spending gets amortized in 3 years and till that time it will stay on balance sheet as an asset
I took the last three years ad spend data, and calculated the unamortized asset worth and the current amortization amount.
The current expense on Advertisement was Rs 5571 crore. We will need to add this amount back to the Operating Income(profit) and subtract the amortization value.

Table 4 : Ad Expnse Amortization and asset creation The latest operating income was Rs 14697 crore. If we add back 5571 and subtract 4801.67, we will get our new adjusted Operating income for Ad spend capitalization. We will get Rs 15466.63 crore. With this new value our operating margin goes from 23.74% to 24.98%.
Compared to the US and Global players, this operating income is very high but I believe with the kind of brand power Unilever has it will keep the same operating margin throught out our valuation timeline if not improve it further.

Table 5 : Comparison of Operating margin - US vs Global vs Unilever India


Now, that we have revenue growth for future years from previous sections and operating margins, we only need to get reinvestments which the company will have to do maintain its revenue growth rate (Remember there cannot be any growth without the company reinvesting in itself)

To get the reinvestment amount, what I did was calculate the historic sales to capital ratio in Table6 - this is revenue for the nth year divided by book value of equity+book value of debt - cash holdings of n-1th year
You can get the book value of debt by summing up the long term debt and short term debt (including all leases) from the balance sheet. Same for book value of equity.
From Table 5, we get the latest the sales to capital ratio at 1.14. It is below the US and global average.
From Table 6, In FY 21, you can see that capital increased dramatically from 3116 to 44212 cr. This happened because of Horlicks and Vwash acqusition. Prior to that the sales to capital ratio average was very high - 16.80. Post the acquisition, the average is 1.27. (I have ignored the 15.09 highlighted in red for my calculation).
I will assume that the sales to capital ratio for the next 10 years will go from 1.51 in first 5 years to 2.36 to next 5 years. It is more than current value and equal to the global 3rd quartile value. (I believe Unilever will be able to juice out more revenue from the acqusitions with its deeply ingrained distribution network in India, and strong brand presence)
Now, we have revenues, assumed growth per year, operating margins and sales to capital ratio to calculate the capital reinvestment needed per year based on revenue growth. For the terminal year, I will assume that growth rate forever is 6% (i.e. Risk-free rate of India).
At steady state, we know that
Growth = Reinvestment rate x Return on capitalFor terminal year, we know that growth is 6%(risk-free rate of India). We will assume the ROC to be 25% which is the global average from Table 5. From the equation above, we will get reinvestment rate for terminal year which we can substract from Operating Income to get the Free Cash flow to the firm aka expected cash flow.
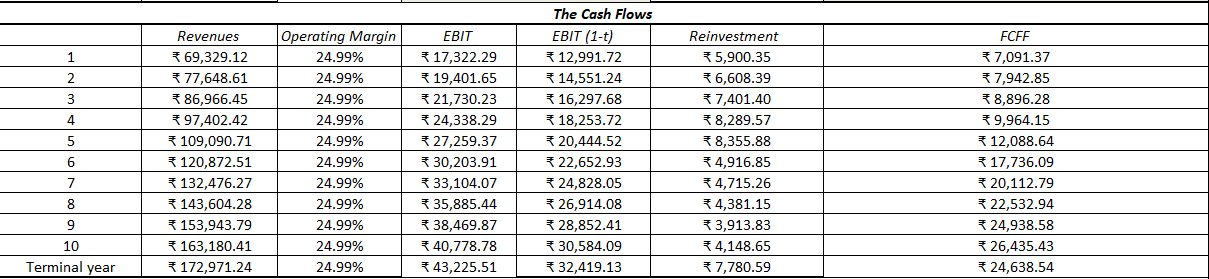
Summing everything up we get :

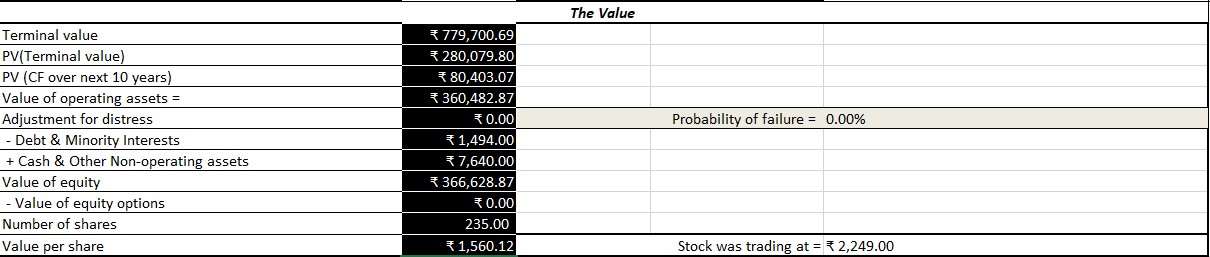
The stock is trading at Rs 2249 vs intrinsic value of Rs 1560
Now, what is causing that market to value the stock at Rs 2249?
These are the levers we can play around with:
Cost of capital (our “r” value): I dont think changing the cost of capital would be of any value as such. This cost is calculated based on the operating region of the company (India in our case) and the current yields in the market for bond rates.
Tuning Gowth: We can play around with growth for next 5 years and see how the value changes
Change Sales to capital ratio: We can change the sales to capital ratio to lower the reinvestment and increase free cash flow to capital
Terminal ROC: We can change ROC to see how the value changes
To accomodate this, I did the following:
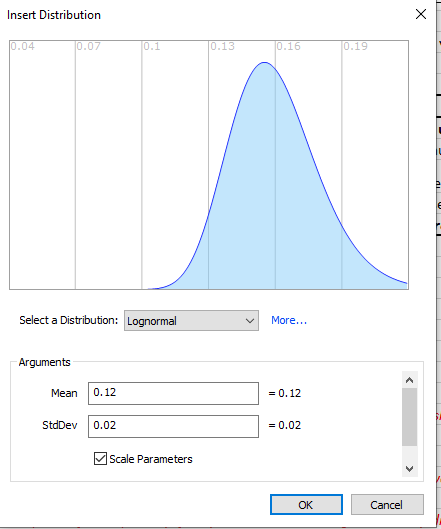
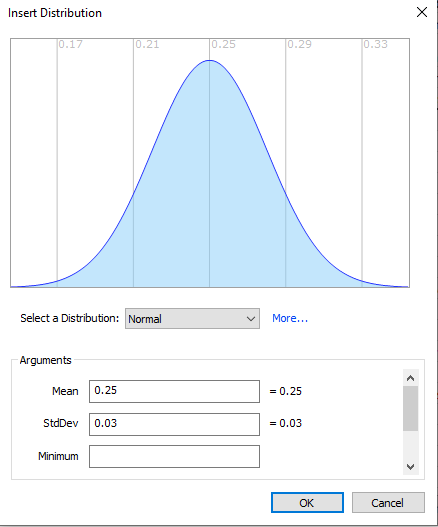
Defined a Growth rate (1st to 5 year) distribution as follows (growth going from 10% to 22% with mean at 12% in lognormal distribtion):

Fig 1 : Revenue growth distribution Defined the sales to capital ratio for 5th to 10th year as follows since I assumed that for 1st 5 years it will be 1.51. The distribution is (sales-to-capital minimum at 1.41, highest at 2.36 and maximum at 7):

Fig 2 : Sales to capital diostrbution for years 5 - 10 Terminal ROC distrbution (ROC in normal distribution ranging from roughly 15% to 34%):

Fig 3 : Terminal ROC distribution Post making these arrangements, I ran the monte carlo simulation for 100,000 simulation fetching me the following results:
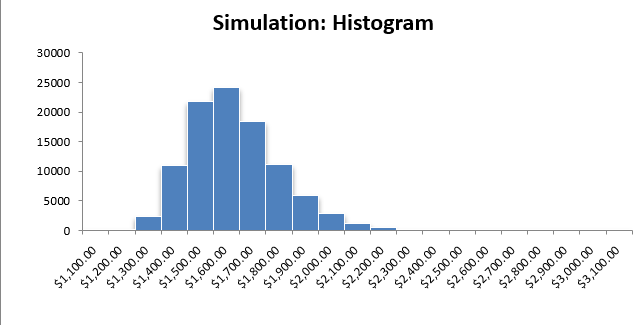
Fig 4 : Share value distribution based on simulation 
Table 10: Simulation summary The mean price is around Rs 1580 from the simulation. From Table 10, you can see that only 4996 simulations fetch value of more than Rs 2000 from the 100,000 simulation(check frequency column).


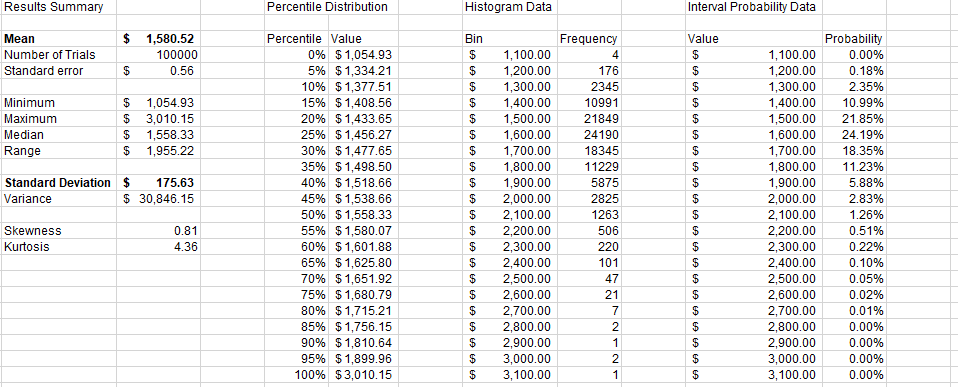
The probability that the price should be more than Rs 2000 is only 5%. Currently, the price is Rs 2249 indeed.
I am attaching my excel sheet for your perusal.
I have used RiskAMP excel add on for simulation. You can give it a try while doing your own research and fine tuning your assumptions.
I would love to see what all I have missed in my story, and if there is any way that the chance of price being more than Rs 2000 can be improved further, and not just be a meagre 5%.
Thank you for your time.
I hope you have found this post useful.