


How You Can Value A Hospital Chain? A Rainbow Children's Medicare Valuation Story

Hello Guys 👋,
In today’s post, we will attempt to value a hospital chain. It specialises in the Pediatrics and Maternity segment and has been around since 1999.
Note: This post is not a stock recommendation by any means. I am not a registered analyst. I love reading about a few companies/stocks, and I am just sharing my understanding and workings here.
I hope you love reading my work.
Let’s begin.
I recently visited my friend in a hospital.
He and his wife were blessed with a baby boy.
Oh Boy! Times are changing.
I used to hang out with him on the streets of Hiranandani, Powai in Mumbai and our major discussion points used to be where should we be chilling in the evenings? A coffee shop, maybe?
I believe now I will have a discussion more around how is the baby doing and whether he is getting any sleep. 😅
At the hospital, I noticed the lobby filled with all would-be: dads, grandmoms, granddads, uncles, aunts etc.
It was full!
I asked him how long his wife was at the hospital. He mentioned that it’s been 2 days. I generally enquired later - what would be the cost of all the procedures and stay? He mentioned a minimum of Rs 200,000 (~ $2500)
My eyes popped up!
I am sure they have insurance but still, that is a lot of money. I am sure that during such emotional times, parents don’t care about these things.
Later, I thought of checking and doing a deep dive to understand more about Rainbow Hospitals which specializes in maternity and paediatric care.
Rainbow’s Story
Rainbow Children’s Medicare, also known as Rainbow Hospitals was established in 1999. It specialises in maternity and pediatric care. It started with a flagship hospital in Hyderabad and later expanded to the southern part of India covering all major cities.
It has 17 hospitals spread across 6 cities with ~775 full-time doctors. The hospital has done some exceptional work in saving babies born prematurely or with a weight less than 1 kg.
As per their last annual report, they have published close to 100+ research papers, have 200+ trainee doctors under their flagship rainbow network fellowship programs, and have also patented a konar-mf device that helps in the treatment of babies with heart ailments (Read here).
How big is the market of Pediatrics and Maternity in India?
As per their annual report FY 22-23, the following was the scenario:
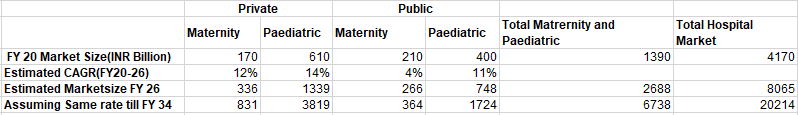
The Total Hospital Market, as per the report, was 3x the Total Maternity and Paediatric market size in FY20 i.e. Rs 4170 cr. The report suggested the growth rates till FY 26.
For my calculation, I assumed that the rate would be as is till FY34, giving me a total market size of INR 6738 Billion ($ 81 Billion at the current exchange rate) in FY34 for the Maternity and Pediatric Segment. The Total Hospital Market size would be around INR 20214 Billion ($ 244 Billion at the current exchange rate).
The U.S. hospital services market size surpassed USD 2.32 trillion in 2023 and is expected to reach around USD 3.79 trillion by 2033.
Based on the above data, the following is the market share of Rainbow vs Apollo (though peer-to-peer comparison might not be possible here):

Rainbow’s is having a very small chuck of a decently big market. Within its market of focus i.e. Maternity and Paediatrics, its last year’s market share was 1.03%.
How has been Rainbow’s Performance?
Rainbow made a revenue of Rs 1174 cr last FY. The trailing 12 months revenue is at Rs 1273 cr (~10% growth)
The recent Q3 FY24 performance would be the following:

Let us look at how Rainbow performs compared to its peers from the hospital segment in India. I considered here a set of 31 hospitals to benchmark the performance in ROCE and Operating margins.

Its Operating profit margin is extremely high compared to its peers. The ROCE is also in the 75th percentile range. Given the segment in which it operates - paediatrics and maternity, it can command a much higher premium than other hospitals.
Rainbow grew its sales and profits at a high rate in the last 9 years.

Valuation
Now that we have some information on its operations, let us try to dive into the valuation.
We will do a Free cash flow to the firm(FCFF) valuation for Rainbow. Assuming a 10-year window, we will assume the terminal growth at the risk-free rate of India after the 10th year.
To calculate the risk-free rate of India, I took the US 10Y risk-free rate currently at 4.34% and the current 10 Y TIPS(Treasury Inflation-Protected Securities), having a yield of 2%. The net difference is the expected inflation in the US i.e. ~2.34%.
We need to scale the risk-free rate of the US at 4.34% based on inflation in India. Getting expected inflation in India is tricky. I don’t think we have a TIPS equivalent in India at the moment. I checked statista website and got the expected rate of 4% in FY27. Let’s proceed with that.
Risk Free Rate of India = (1+ 4.34%) x (1.04/1.02) -1 = 6.38%. Next, let’s check revenue growth and get some estimates.
The recent revenue growth looks to be around just 10%. The management in the recent earnings calls attributed this lower/muted growth to the year being relatively healthier and the absence of strong seasonal businesses during the quarter Q2FY24, which typically contribute significantly to revenue.
If we assume that the muted growth for the year was an anomaly, we still need to figure out what the growth looks like for the hospital in the coming years. To figure this out, I looked at the expansion plan for the hospital and tried to get a sense of growth by assuming that at the operational level metrics would be as-is.
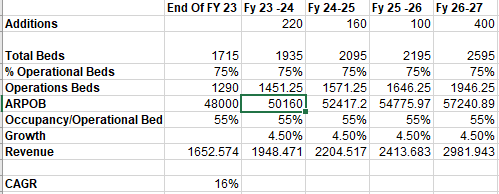
The expansion plan is as follows:

Expansion plans for Rainbow I took a snapshot of the current operational metrics and used them to get the CAGR revenue growth value.
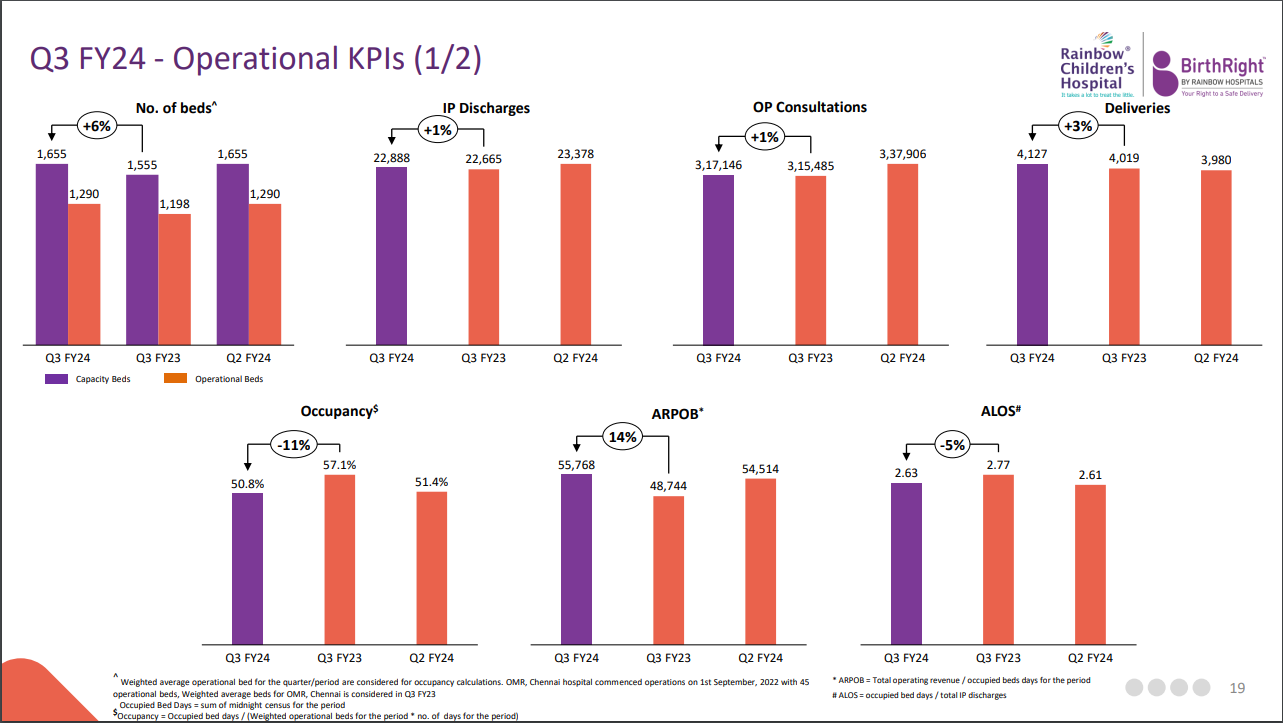
Operational metric of Rainbow Q3FY24 
Projected Sales GAGR till FY 27 I assumed that the operational beds to total beds ratio would be around 75% as at the end of FY23. The Average revenue per operating bed (ARPOB) for FY23 was around Rs 48000 and recorded a 4% yoy growth. I assumed the ARPOB would hover between 4-5% - the same rate as expected inflation.
I assumed the occupancy per operational bed to be around 55% (as-is) and calculated the revenues. I get a CAGR of around 16%.
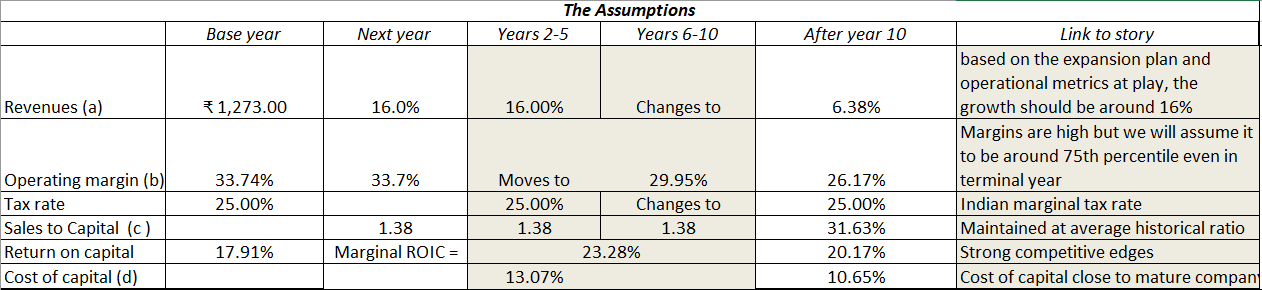
I will assume 16% to be the revenue growth for the next 5 years y-o-y and taper it down to the risk-free rate of India as we reach the terminal year.
Once our revenue growth is fixed, we need to check how the operating margins would behave. Our current operating margins hover at around 33%. We already did a benchmarking of around 31 hospitals. I will assume here that given a really niche segment for Rainbow, it will be able to maintain an operating profit margin in the 75th percentile range. I will move the Operating margins from 33% to 26.17% as we reach the 10th year.
Next, we need to calculate the reinvestment needs. For that, we will have to check how the hospital has performed historically in sales to capital ratio.


I will assume that the sales-to-capital ratio will continue to be as is for the next 10 years. The beautiful thing about using Prof. Aswath Damodaran’s Excel is that he provides industry benchmarks. These are difficult to get unless you have access to services which provide such data. Do check the sales-to-capital ratio. Rainbow’s historical of 1.37 is just at the global average.

Sales to Capital, Operating margin and Sales growth comparison All things are almost set except the cost of capital. I used Prof. Damodaran’s excel to get the cost of capital directly. It was 13.07%. I assumed that in the terminal year, the cost of capital will be closer to a mature company’s cost of capital i.e. risk-free rate + Equity risk premium @ 4.5% = 4.03%+4.5 = 8.53% in $ terms. We need to scale this to Rupee terms since we are valuing in Indian currency.
(1+8.53%) x (1.04/1.02) -1 = 10.65% would be our terminal Cost of capital. At the terminal year, I assumed the Return on capital would be equal to 20.17%. (average ROC of US hospital sector - check here)
So, summing all things up, we get the following:

Assumptions made so far 
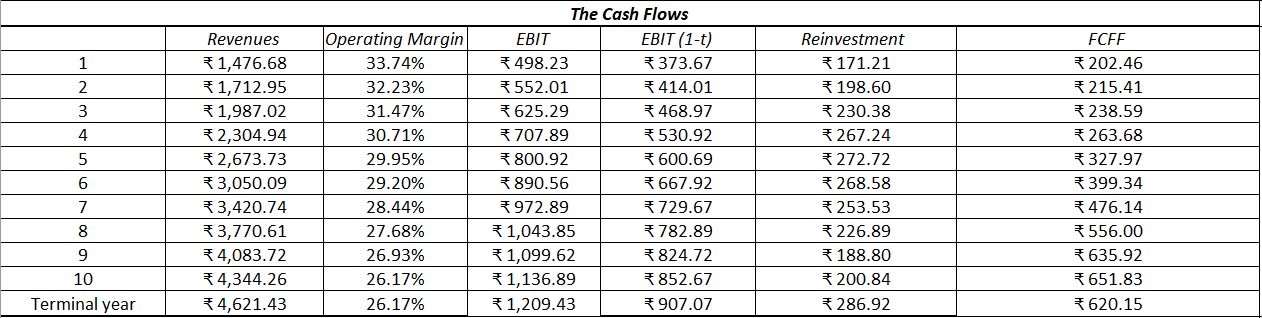
Cashflow Situation 
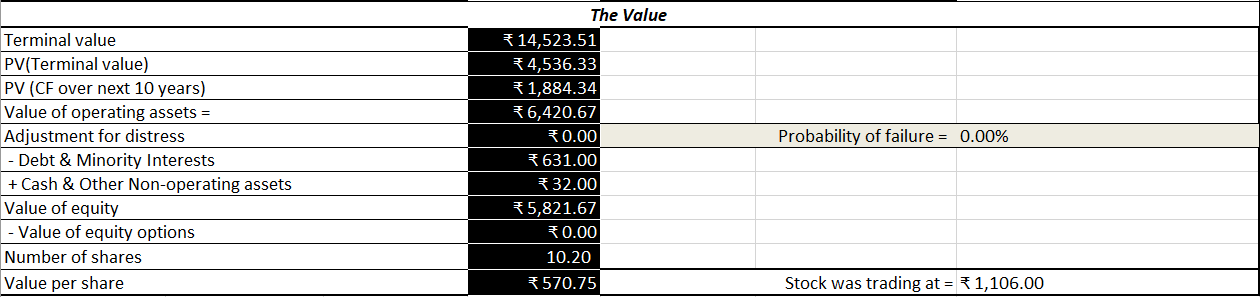
The final value We get a value per share of Rs. 570.65. The current price per share is Rs 1106. Based on our assumptions, the stock is trading at a much higher value.
To understand the key drivers better, I ran a Monte Carlo simulation with the Operating margin having a triangular distribution with min = 24%, most likely=26% and maximum=34% in the 10th year. For revenue growth between 2-5 year period, I took triangular distribution again with minimum = 13%, most likely = 16% and maximum = 25%.

Operating margin Distribution 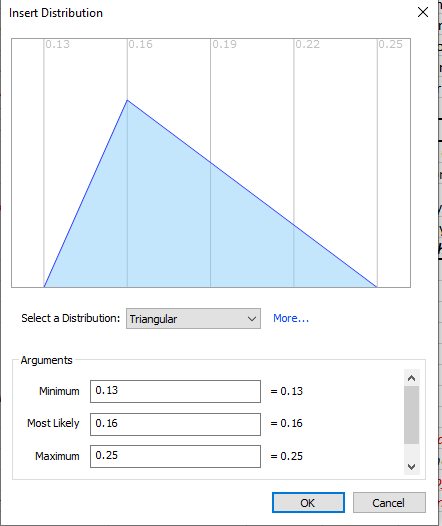
Revenue Growth Distribution For Return on capital in the terminal year, I assumed the ROC to be normally distributed with mean = 22% and lower end = 18% (avg of hospitals) and higher end at 30%.

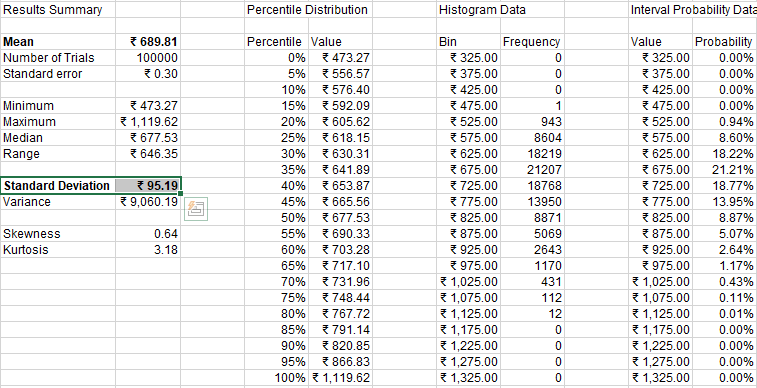
The following is the simulation result:

Simulation Data result 
Share Price distribution Based on the above considerations and assumptions, the share value has a mean of Rs 689 ( Almost a 30% discount to the current share price ).
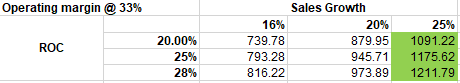
Now the question is what parameters can justify the current share price of Rs 1106? For that, I did some benchmarking analysis and the following are the results:

ROC vs Sales growth with OPM @ 33% in the terminal year 
OPM vs Sales growth with ROC @ 20.17% in the terminal year Based on the above two data sets, the current market price of the stock will only be justified if the company can grow at 25% per year for the next 5 years! Now, is this case a possibility? For this I went back to the expansion plan and played with the numbers.
The only way for Rainbow to realize 25% revenue growth for the next 5 years would be to increase the Average Revenue per operating bed by 13% every year

Modified expansion plan with 10% growth in ARPOB This looks like a very difficult proposition to achieve because they will have to increase the prices of each service currently used in the calculation for ARPOB by 13% yoy. If Rainbow choose to do this per year, competitive forces will come into play and they might have to lower prices eventually. This might also affect the ROCs used in calculations.
Overall the stock is trading at a much higher value than what fundamentals assumed so far paint the picture to be.
The overall market share, based on our assumptions, is the following as we progress through the years.

Market share and cagr The market is growing at 14% cagr based on our earlier assumption, and Rainbow has a CAGR of around 13% (we assumed 16% growth from year 0 - year 5 and from year 5 to terminal a y-o-y decline to reach the risk-free rate of India).
I have attached the workings here. Feel free to download and play around with the excel. I am thankful to Prof. Damodaran for helping us all with a free excel to quickly carry out such calculations in one sheet.


That is it for Rainbow Children’s Medicare.
I hope you have enjoyed reading the article so far. If you enjoy my work, do consider subscribing.
Thank you for reading.
See you in the next post.
.