


What does Affordable housing say? A quick story on Aavas Financiers.

Hello Guys 👋,
I have been MIA for some time. I was travelling a bit.
Anyway, I thought I would share something new this time. I have been writing this post for close to 20 days now on and off and could not focus on it continuously. A valuation of a company in the sector I have been interested in for some time.
This post is not a stock recommendation by any means. I am not a registered analyst. I love reading about a few companies/stocks, and I am just sharing my understanding and workings here.
I hope this post is viewed more from an educational lens. I hope you enjoy reading this post and your comments are welcomed. I wish to learn more by writing. 😁
Let’s begin.
From January 2024, Bank Nifty, a composite index of 12 banks in India, has fallen by around 5% - Kotak Bank and HDFC Bank fell by around 8% and 18% respectively.
Aavas Financiers, an affordable housing finance company, has fallen 12% from its peak in mid-January.
A major reason for the fall has been associated with higher interest rates in the ecosystem and shirking net interest margins (NIMs). NIMs are nothing but the difference between the interest expenses which a bank has on the borrowings such as deposits etc. and the interest income which they get on loans.
Before getting into the valuation of Aavas, let’s quickly check what is in the news for the affordable housing sector at the moment.
Affordable Housing in News
Recent articles in Mint and BFSI by Economic times stated the following:
Prevailing high-interest rates had a minor impact on affordable housing demand. Demand initially decreased but as interest rates stabilized, it picked up in the later part of the calendar year.
There was a recent dip in the urban areas for affordable housing but the demand in tier-2, tier-3 cities remained robust.
There has been a constant disinterest from affordable housing developers in urban sectors due to higher interest rates and increased raw materials costs. They are focusing more on the mid and luxury segment at the moment. The share of affordable housing to new homes in urban areas decreased from 42% in 2018 to 18% in 2023.
Government focus has increased beyond the top 12 cities now, putting tier-2 cities in the focus frontline.
Ravi Subramanian, CEO - Shriram Finance, said “.. So far, FY24 has been a strong year for financial services as consumer demand has been robust. With high home sales and booming construction activities across tier-2 and 3 cities and rural India, the demand for home loans, including affordable housing loans, is expected to jump in FY25. Stellar GDP growth, overall buoyancy in the market, and the stability in RBI’s policy rates are contributing to this optimism”.
State Bank of India, the biggest public sector bank in India, joined hands with 5 housing finance companies to increase exposure to housing loans in tier-2 tier-3 and rural cities. DBS became the first foreign bank to enter this space.
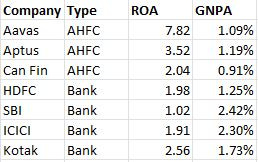
Why are the banks lapping up housing finance companies?
Secured loans and lower delinquencies relative to banks, and a higher ROA.

Higher net margins (~5%) compared to banks (~3-4%).
Higher scope for growth and higher demand in tier-2 and tier-3 cities.
Priority sector lending goals of banks, as set by RBI, can be met by partnering with Affordable housing finance companies.
Affordable Housing Finance Market Size
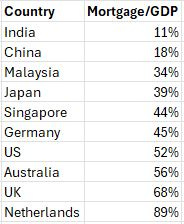
The outstanding mortgage loans are estimated to be around $360 billion, ~10.6% of the Indian GDP of around $3.389 trillion in FY22. The mortgage loans to GDP ratio of a few countries including India is as follows(Aavas’s annual report FY22-23):
The affordable housing finance size is estimated to be around $51 billion with an estimated growth rate to be around 15%. Assuming India’s GDP growth rate to be constant at 8.9% and mortgage loan book growth to be at around 13%, the following image paints the picture for us with numbers for the next 10 years.

The assumption that the loan market size will double by 2027 roughly makes sense as per the current assumptions. We also see that the Loan market/GDP ratio will be 16% by 2033 (18% is for China, as mentioned in Aavas’s annual report).
Aavas Financiers’s Recent Performance
We will break our discussion to look into the performance of the company on the following parameters:
Financial performance: AUM growth, Profit After Tax Growth, and Yield Spread
Risks: Geographical spread of operations, Customer category, and Funding Mix.
Financial Performance
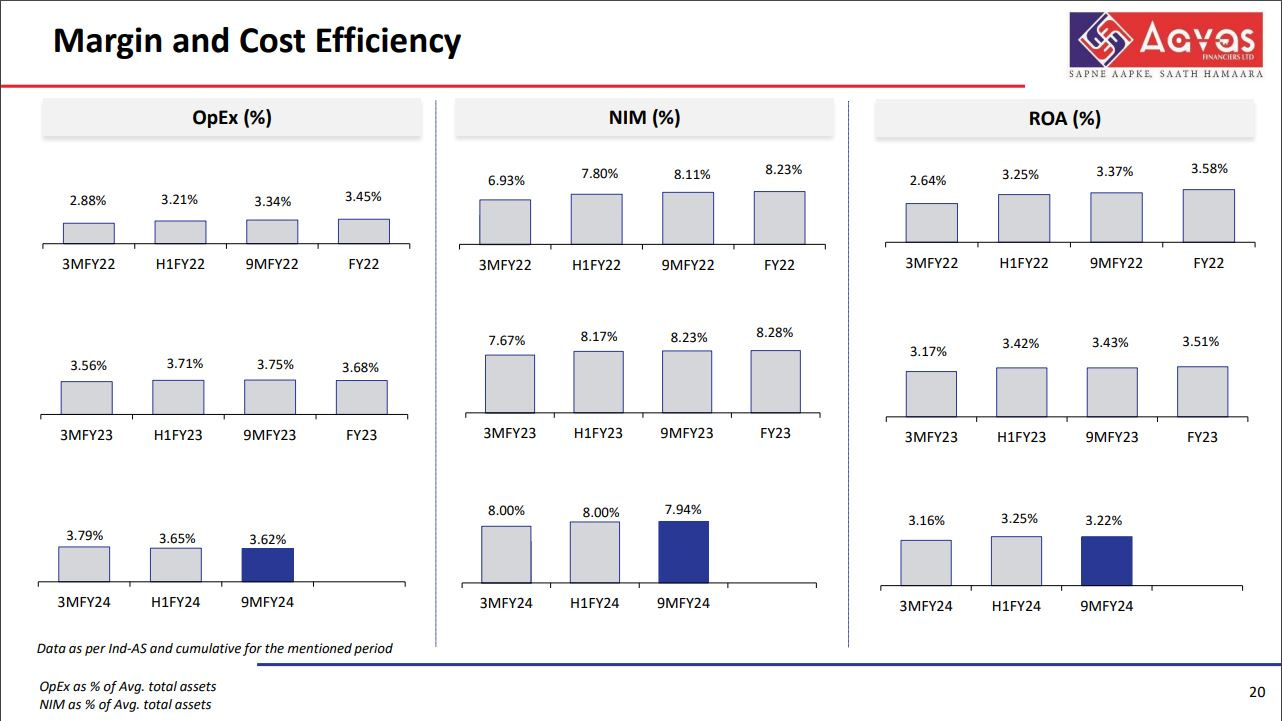
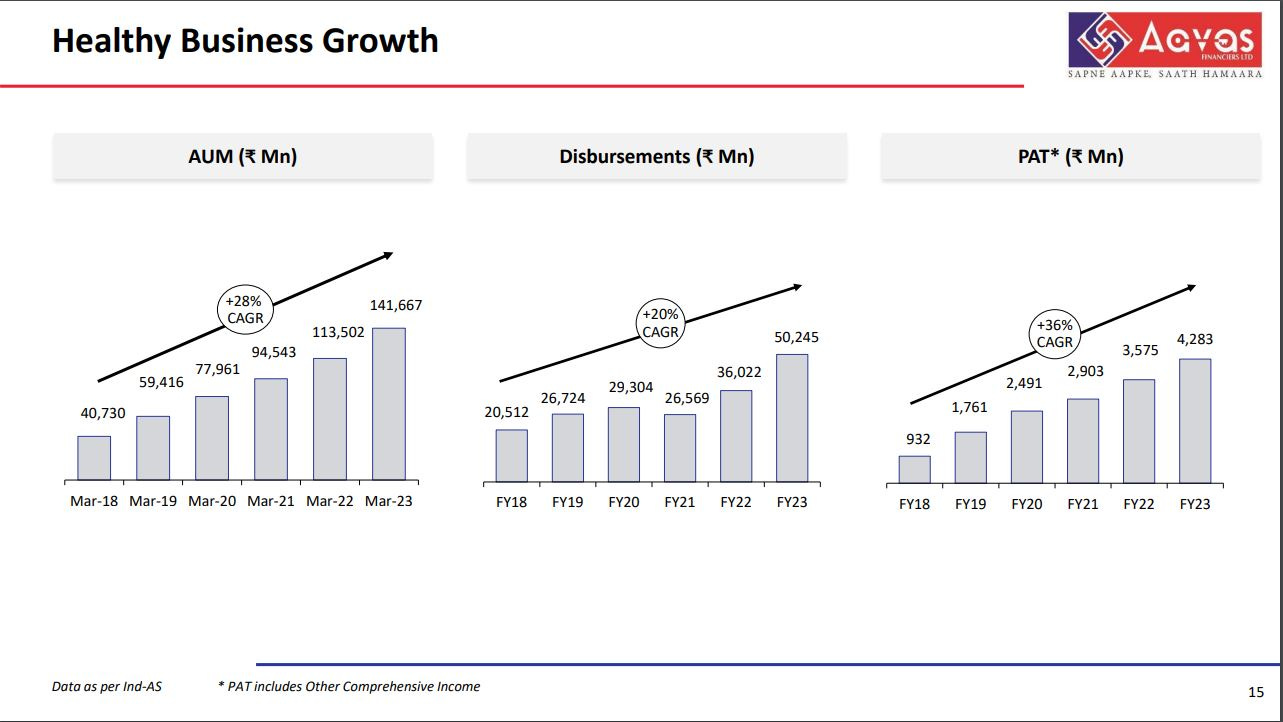
Aavas has had a healthy growth rate in AUM and PAT since 2018. I have taken the images from Aavas’s latest filing.

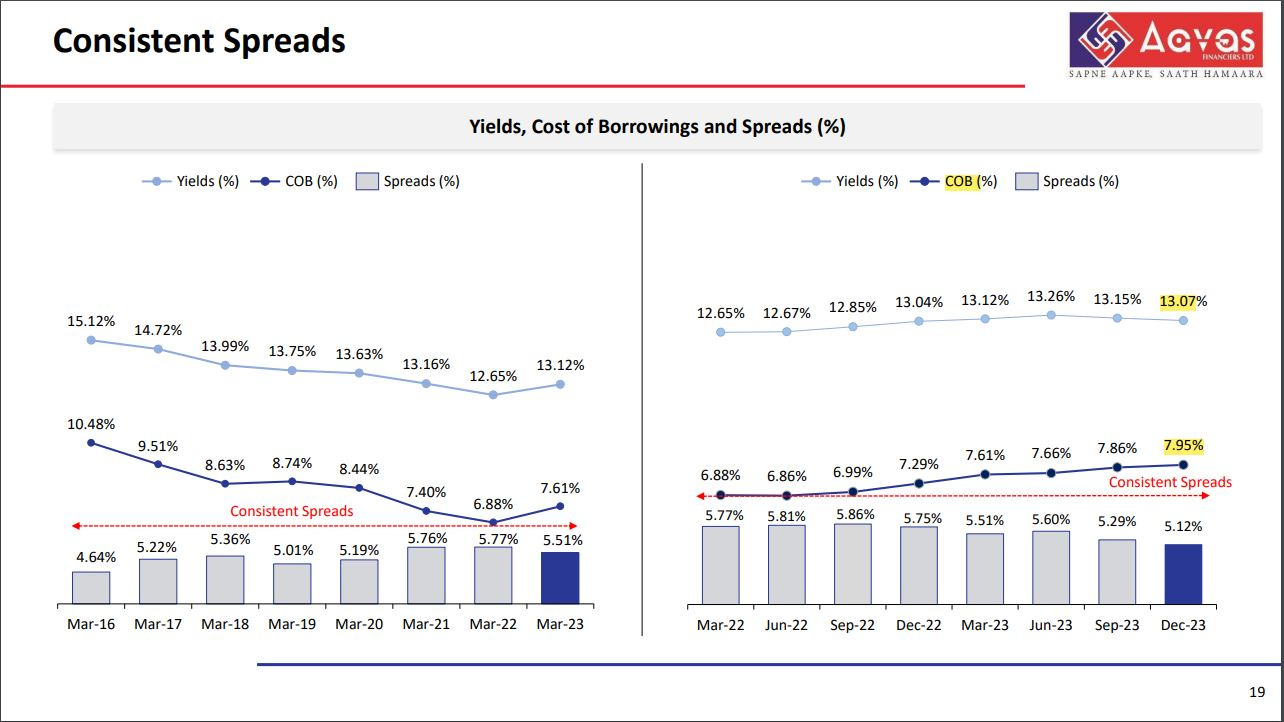
It has been able to command a healthy yield spread the over cost of borrowing even in the higher interest rate environment.

The NIMs have taken a slight hit given the high-interest rate environment and the same is reflected in the ROAs, however, the operating expense has been lower than last year.

Risk
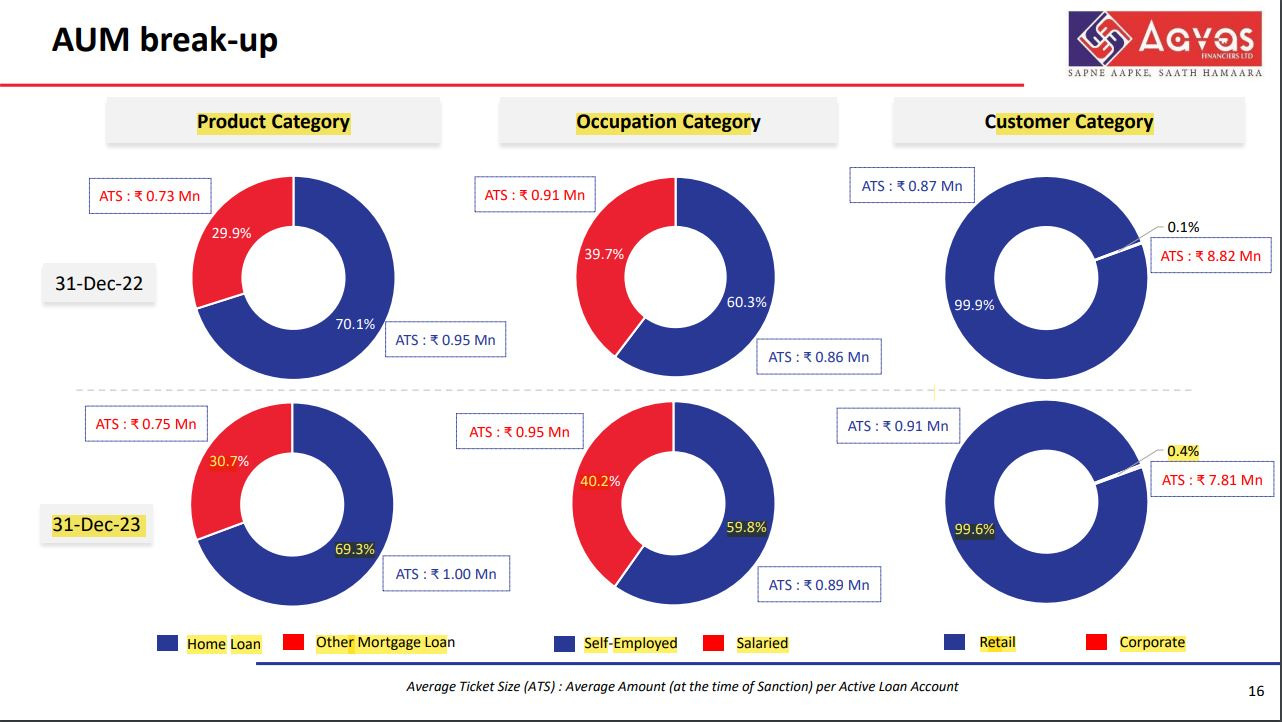
Aavas has mostly focused on home loans and this seems to be consistent. The salaried to self-employed ratio has been almost the same and is expected, given that it operated mostly in tier-2 and tier-3 cities. Since most of the loans are taken by individuals, there does not seem to be any key customer risk as such.
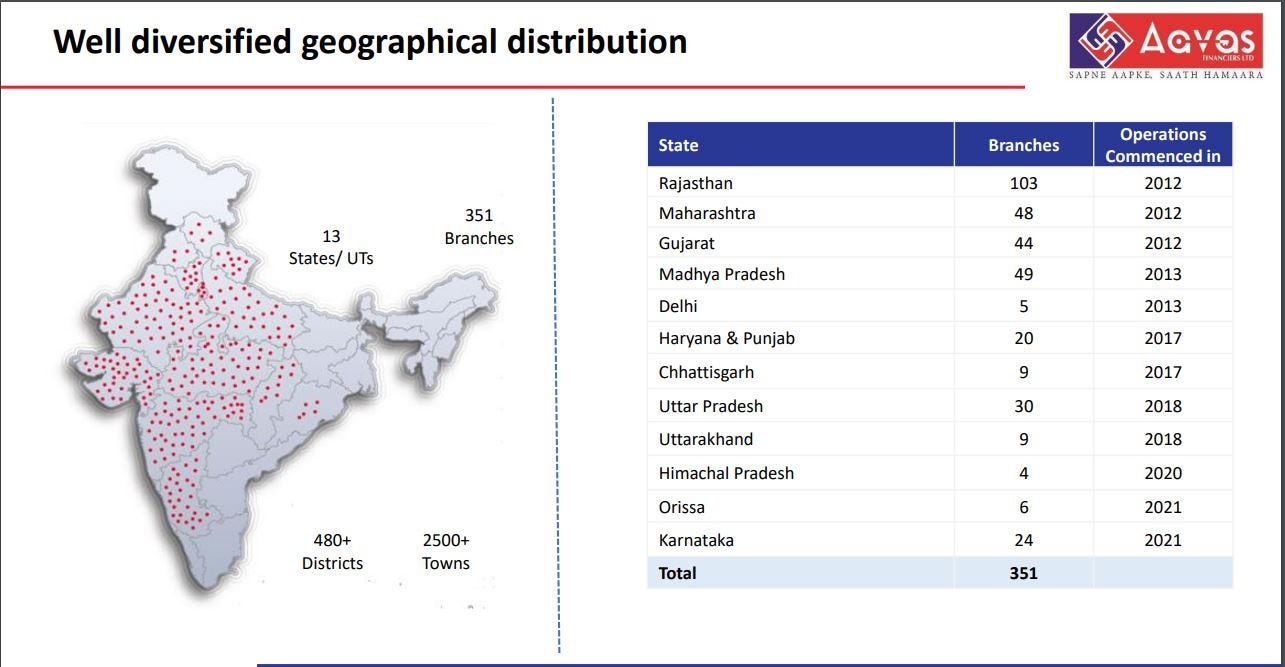
The geographic presence is well diversified.

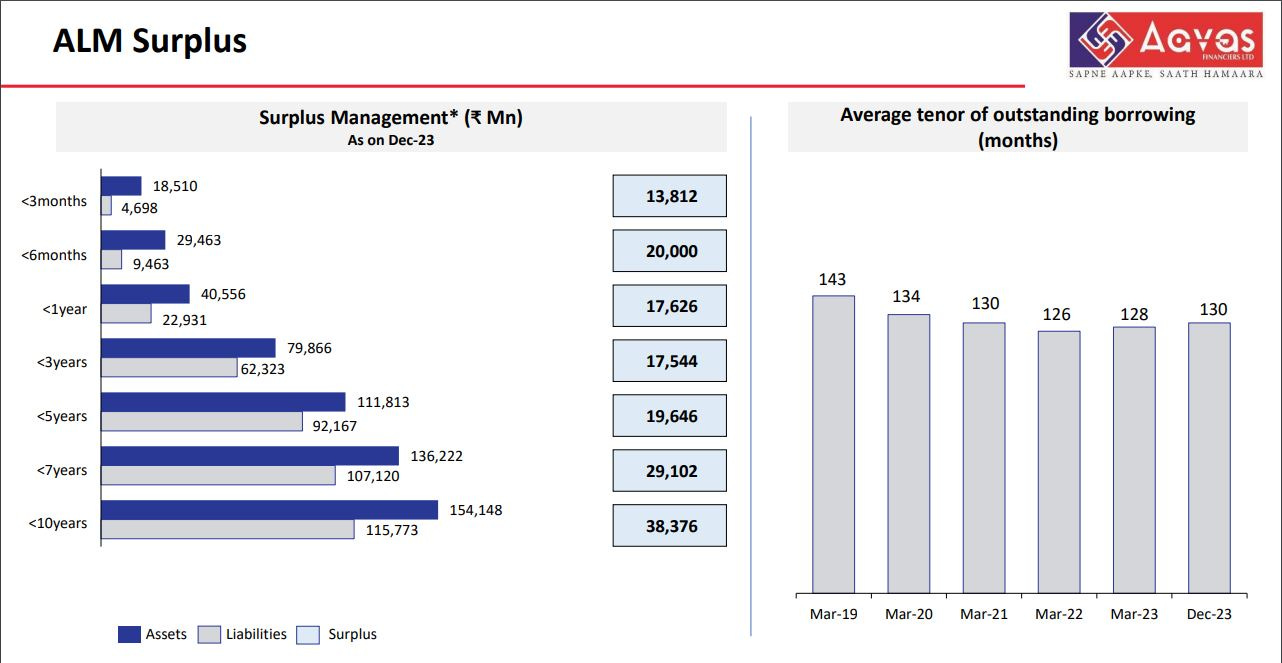
On the Asset Liability Management (ALM) front, the company looks well managed as well with surplus available on all the fronts and average loan tenure seems to be around 130 months.


Fundamental Valuation
We will be evaluating Aavas using the Excess Return Model. Let’s begin:
The latest trailing twelve-month net income of Aavas is 475 cr.
The Book Value of Equity at the end of March 2023 was 3,270 cr, making ROE 14.52%.
To get the Cost of Equity, I did the following:

I took the US risk-free rate (RFR) and the equity risk premium(ERP) for the US from Aswath Damodaran website. I added the default spread of India to ERP to get 7.81%. RFR + Beta x ERP gives me 9.51%. I took the beta for Aavas from Yahoo Finance.
Since I am doing the calculation in Indian Rupees I scaled (1+9.59%) x (1+inflation India)/(1+ US inflation) -1 to get 11.41%
All the calculations are as follows:

I input the beginning BV of equity and ROE of Aavas calculated above. From that, I get the net income. I calculate the Equity cost by multiplying the COE x BV equity. The difference between net income and equity cost is the excess return on equity.
Since Aavas is not paying dividends, I don’t expect it to for the coming few years and have assumed that the company retains 100% of the earnings. The retained earnings get added to the BV of Equity which acts as a base for the next year.
In the terminal year, I assume that the net income grows forever by 4.75% (risk-free rate of India, 10-year govt bond - default spread of India) and I calculate the rest of the values.
I take the present value of excess return for all the 10 years including the terminal value using the COE and I get the PV as 12,26,556.89 lakhs. I add this PV to the initial BV of Equity of 3,27,000 lakhs and subtract the after-tax ESOP value.
I got the ESOPs value from the Black Scholes model - Rs 221. Multiplying the value with the total number of options outstanding gives me the total ESOP value.
Dividing the value thus obtained, gives me per per-share value of Rs 2157. The stock was trading at around Rs 1423.


I hope you liked the fundamental valuation I did for the company. I would love to hear feedback from you all if any.
This work is purely for understanding how to approach valuation and keep on learning about it. This is not a stock buy-sell recommendation in any way.
Thank you
Hi, why did we in the calculation of initial ROE (the 14.52%), considered income (TTM) and BVE (FY 23) from different time range? Will this not give us a inflated value of ROE?
Good post. There were few abbreviated terms which were tricky to understand given i am a beginner. Do you recommend reading any articles which can help me understand the basics assumed here?