


Max Healthcare is costly at PE of 74, How about PE of 46?
A Fundamental Analysis and stock deep dive of Max Healthcare

Hi 👋🏻,
In India, Healthcare is messed up.
The state run hospitals have almost no facilities which you can avail, and one has to rely on private hospitals by paying for services on his/her own or through an insurance.
I was talking to my mom few days back, and she mentioned that during her teenage and early 20s days, she does not recall visiting private hospitals for any treatment.
There were a lot of doctors having their own practice, but most people used to visit government run hospitals for their treatment.
I guess it was in the last 1990s that most of these big private hospitals started their journey.
Anyway, In today’s post, let us try to understand Max Healthcare in as much detail as possible from a valuation point of view.
Let’s begin.
Note: I am not a registered advisor or agent. Anything I write in these posts are purely for your entertainment and educational purposes. Nothing in this post is an advice for you to make an investment or buy any stock. You are free to download the Excel and play around with it.
If you haven’t checked my last post on Zomato valuation, do check here.
About Max
Max Healthcare is the second-biggest hospital chain in India in terms of revenues and market capitalization.
It has total bed capacity of around 3550 beds.
It has 17 facilities in India, and boasts ~75% bed occupancy in India.
In the latest ppt of Q3FY24 (December), we get some good insights into the health care sector.
Max Healthcare has 82% of beds in metro cities. As per Fig 1, Delhi NCR has a severe demand and supply gap.
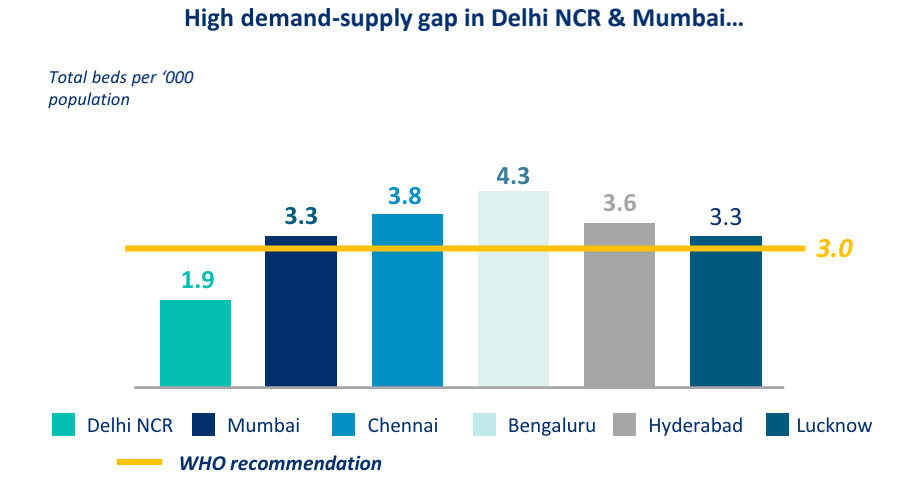
Given that most of the beds for Max Healthcare are in the metro area, the average revenue per operating bed (ARPOB) (a term used specifically in hospital industry) is also very high.
Max almost has 2900 beds in the Delhi NCR and Mumbai region!
The higher per capita income in metros, higher insurance penetration, availability of specialized staff and the tendency for people to pay for high-end care are some of the key reasons which give hospital in such regions a higher ARPOB.
If most or all of your beds are focused on these areas, You are able to command a premium for the services offered.

I think this strategy worked really well for Max.
This can be seen in the ARPOBs, the occupancy rates, the pre tax ROCE (Return on capital employed), and operating EBITDA per bed in Fig 3.
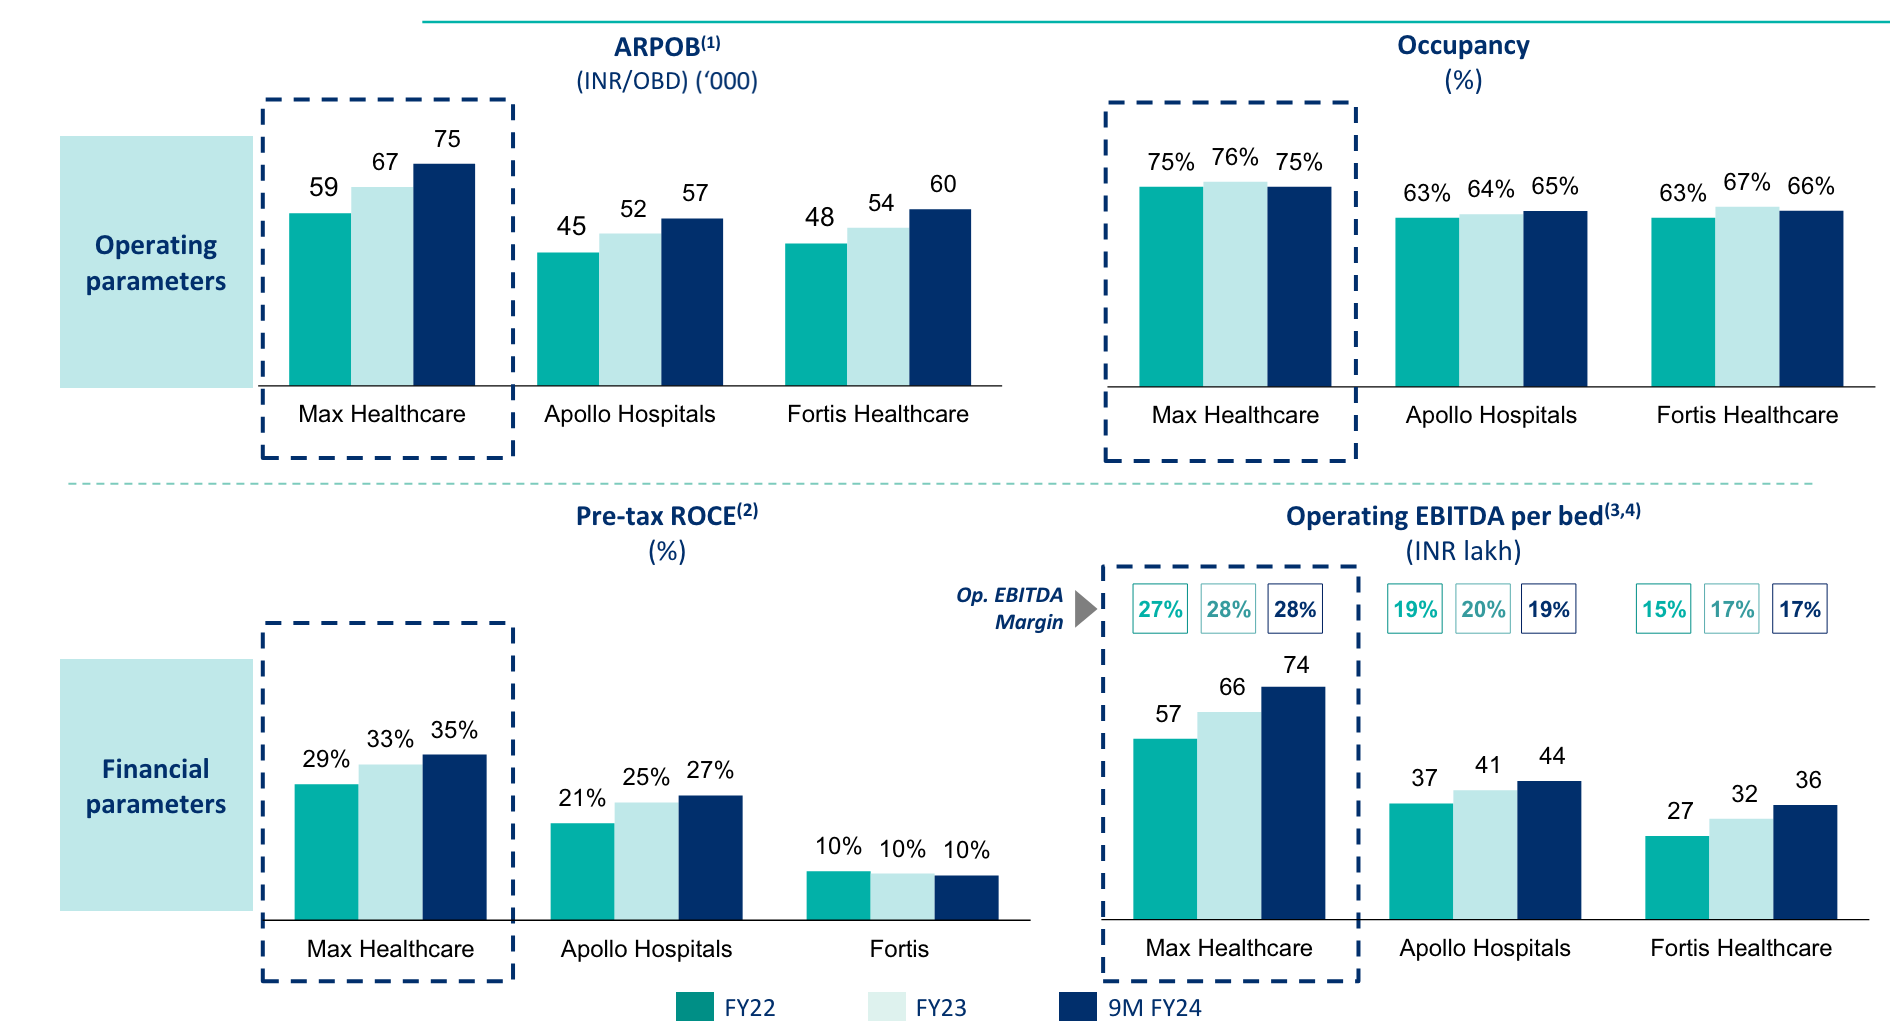
In all the parameters, Max is doing significantly well.
We will recalculate the ROCE though, I will explain why I did that when we reach that point.
Growth Reasons
Max attributes the following (listed in Fig 4) as the main reasons for its growth potential.

Apart from surplus cash of Rs 1295, and strong cash generation from operations, the reasons listed by Max are as follows:
They are focused on fine tunings the operations to squeeze out more revenue, and are focused on building up on their speciality side and focusing on improving case mix.
Case mix is nothing but kind of patients which occupy operating beds.
You would want to churn the same bed through multiple patients in a month, with higher revenue generating procedures happening while the patient is occupying such a bed.The lower value adding minimal care procedures can happen in general ward or patient can be asked to go home if all things are almost sorted at care level.
A brownfield project is a project in which the hospital already has set up and the operations are running. It is more like capacity expansion. Max is saying that ~2600 beds will be added as a part of brownfield expansion.
A greenfield project is a project in which a fresh parcel of land is taken, and a hospital is built on it. Max is saying that it has acquired land parcels to build 1000 beds capacity hospitals.
It has been doing mergers and acquisitions, and has recently acquired a hospital in Nagpur and Lucknow. They are saying that their return on capital on such hospitals reach 20% -25% in 4 years period post acquisition.
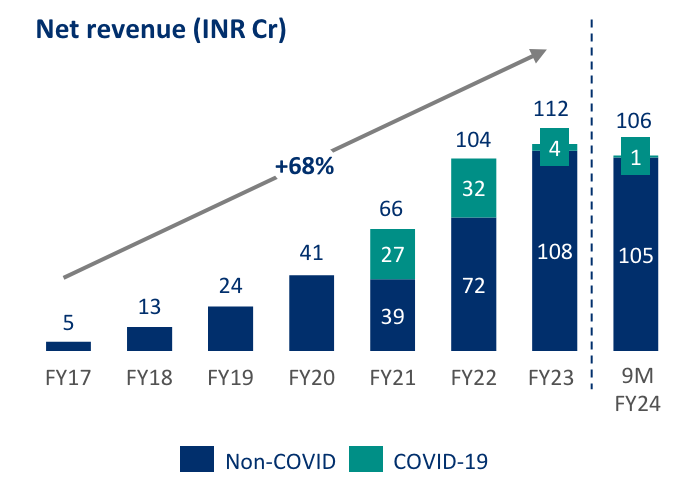
We will re-calculate ROC(or ROCE) for Max ourselves in coming section.It has two brands - MaxLab and Max@Home - which are its offering in diagnostics and home care space respectively. Both are revenue generating arms of Max (Check Fig 5 and Fig 6)
It has a brand in the market—which I agree with completely. We will work on how the advertisement and promotion spend should be handled for Max in coming section.

Return on Capital Employed (ROCE)
Let us calculate the ROCE for Max now.
After Tax Return on Capital Employed = EBIT(1-tax rate)/ (Prev year BV Equity + Prev year BV debt - Prev year cash)
EBIT = Earnings before interest and taxes
BV Equity = Book Value of Equity
BV Debt = Book Value of Debt
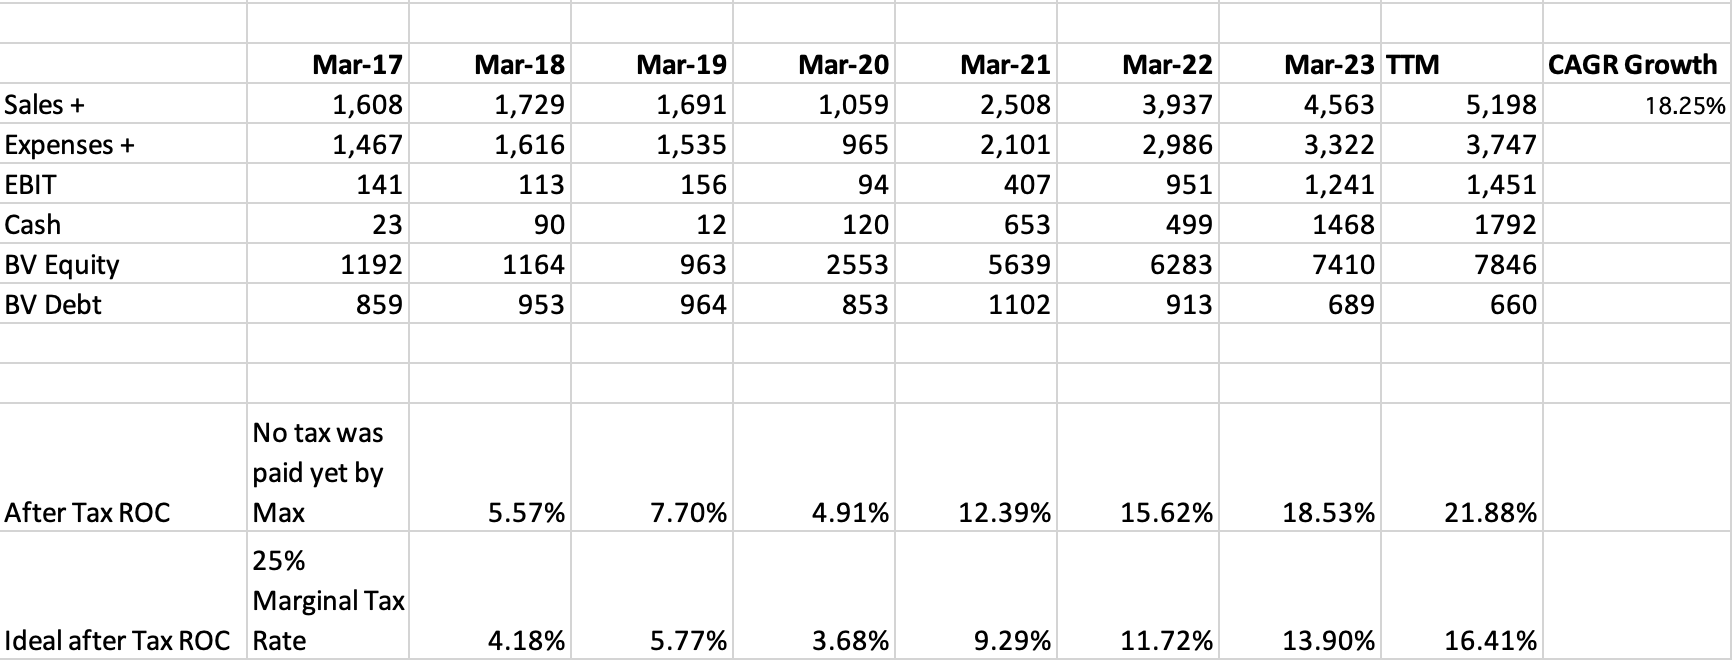
We can see that the trailing twelve month(TTM) after tax ROC is around 16.41%, but you can see that there is also a value 21.88% just above it. What is that for?
Well, Max has reported no income tax in profit and loss statement in most if not all the years so far. If I consider this value as it is, the ROC is 21.88%, however, this will not be feasible in the long run and the tax effect would kick in. The tax effect would make the ROC to be around 16.41% in the latest year. (I considered the tax rate of 25% i.e. marginal tax rate)
Now, you might have a question that why did I calculate ROC in the first place?
Well, the ROC reported by Max seemed to be really very high.
I noticed that they calculated ROC as:
pre tax ROC = Operating income/ ( Tangible net worth + total debt + deferred tax liability)
Tangible net worth = Total assets - Total Liabilities - Intangible Assets
This definition I have problem with.
In definition of Tangible net worth, Intangible assets are subtracted. But why?
Total Assets - Total Liabilities = Total Shareholder Equity.
Intangible assets are assets such as Goodwill in the balance sheet. Goodwill (as an asset) arises during acquisitions, when the acquirer pays over and above the book value of the acquiree company.
Subtracting this value from Total Shareholder Equity essentially nullifies the acquisitions effect by the acquirer arising due to overpayment, which is not a correct way to judge this ratio. The money is already paid. Why should we subtract this overpayment!?
Deferred tax liability arises because of business operations. This will be true for all companies across the globe. We want to check what is the return the company is generating based on the capital put in the company.
Capital is debt + Equity.
We should not be involving any other term.The ratio in its truest form is the one I listed just below the start of this section.
Investing in Brand Building
Now, that we know the correct value of after tax ROC, let us try to understand how brand/marketing related expenses could be handled.
At the moment, Max is expensing all the promotion expenses from revenue, but is it correct?
The money spent on branding and promotion activities create a recall value in customer’s mind. This value could have effect beyond the year in which such an activity was carried out.
So, to address this issue, what we will do is push all such expenses in a brand asset on the balance sheet. We will further assume the amortization window of 3 years.
What does this mean?
Well, say in year 0, our expense was $99. We will assume that by year 1, $66 will remain in our brand asset and $33 will be expensed in amortization. In year 2, $33 will remain in brand asset and again $33 will be expensed in amortization.
Essentially, 1/3rd of the amount gets expensed each year till the brand asset goes to zero in our balance sheet.
To calculate what the potential expense for promotions/marketing could be, I checked the marketing expense to revenue ratio for the last 4 years.
The ratio is dropping each year, however in absolute terms, the marketing expense is increasing. This shows that such marketing expense is adding more in revenue per year than what is getting expensed.

We will assume here for all calculation purposes that 1.26% of revenue is a good indicator of marketing expenses, and it will continue to be so.
check the tab called “Marketing Expense” in attached excel)
Our TTM revenue is 5198 cr. Considering 1.26% of revenue, the expected marketing expense would be around Rs 65.49.
Now, instead of expensing it we will add it to operating income, and also create a marketing and brand asset using this and previous such expenses.


This increases our operating income by Rs 25.85 cr, creates a promotional/branding asset for Rs 118.73 cr, and amortization of Rs 39.64 cr.
We will use these adjustments to for revenue projection in future years.
(Please check the tab called “Ad & Promotional Expense” in attached excel)
Growth Rate
So far, we have our new ROC, our new adjusted Operating Income based on Promotion/Branding Asset.
Now, we need to understand what the growth rates in coming years would be.
A quick Information cookie for you all:
Growth in Revenues = Reinvestment Rate x Return on Capital
You might need to the percentage points related to growth in ROC, if ROC is improving too.
For example, assume ROC improved from 10% to 12%, and reinvestment rate last year was 60%, then the growth next year will be:
growth = 60% x 12% + (12%-10%)/10%*100 = 7.2% + 20% = 27.2%
From 2019 to 2023, Max has grown revenues from Rs 1691 cr to Rs 4563 cr, growing at a CAGR of 28.17%.
Let us try to calculate the growth next year, and from year 2-5 in our calculation(We will assume a 10-year window, projecting growth till year 5 and assuming the growth drops to risk-free India rate by 10th year)
I pulled up the last 5 years of data and calculated the reinvestments and its rate at aggregate level.
We get reinvestment rate of 112% (Max is doing acquisitions, FYI)

Now, for next year, I will assume max improves ROC from 14% to 16%, and then for year 2-5, it improved from 16% to 20%. I assumed that reinvestment rate drops to 90% for year 2-5.
We will get the growth as ~33% next year, and ~24% for year 2-5.
(Please check the tab called “growth estimation” in attached excel)
Could I be wrong in these growth rates?
Of course, I am very sure I will be wrong.
But the idea is not avoid being wrong, idea is looking at the data and making a judgement.
And, such judgements can be off.
Valuation
With all parameters in place, let us try to value Max.
We will use Prof. Aswath Damodaran’s excel as always.
(Please check the tab called “Input” in attached excel)
Input all the information required in the input sheet with cells marked yellow.
The initial Cost of capital is around 11.70% and decreases to 9.74% in terminal year.
I assumed that the current operating margin of around 28% goes to 18%.
Why 18 %?
Well, as you can see that the third quartile hospitals boasts around 18% in operating profit.
I assumed that the ROC in terminal year is around 20%.
Why 20%?
As you can see that US average ROC is around 20%. I am assuming the ROC value would mimick a mature market ROC
I also calculated the value of options outstanding using Black-Scholes model and subtracted the value obtained from Value of Equity.
Considering all this, we get the value of share to be around Rs 620
The current price per share is around Rs 810.
Based on our current calculations and assumptions, the revenues in 10th year is Rs 42 ,065 cr.
Based on the this article, the market size for hospital segment by 2034 is as shown in fig 12.
Our 10th year revenue will be around 3% of total market size of hospital sector in 2024

1.76% looks to be manageable as per our current calculations.
Now, you might have a question here?
What would need to be true for fundamental value to be more than 800?
For this, I checked the value per share against the Operating margin increment/decrement and growth rates.
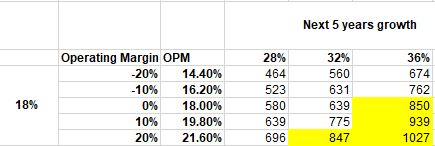
As you can see, for the value to be more than 800, we would need the terminal year operating margin to be 20% and growth per year for next 5 years to be atleast 32%.
Operating margin seems a possible case, but growing 32% per year for next 5 years could be a challenge.
Can I be wrong here?
Definitely.
Fundamental valuation provides a framework for thinking on what levers the company can play to justify the price which market is attributing to it.
My narative is Max will continue expansion and acquisitions.
It will try to grow organically and inorganically. Given the aging population has decent exposure to wealth, Max is uniquely placed with its focus on metros. It will focus in coming year on tier 1/2 cities such as Pune, Nagpur, Jaipur, Bhopal, Hyderabad etc
However, a growth of more than 30% would be a challenge.
Summing up


Tabs to look at in the Excel:
Input Sheet
Marketing Sheet
Market Size
Growth Estimation
Valuation Output
Option Value
Ad and Promotion Expense
Cost of Capital Work sheet
Thank you for your time.
I hope you found this post useful.
See you in next post.