
How Would You Value Zomato
A fundamental and detailed valuation of Zomato operations and its stock

Hello Guys 👋🏻
I am a Swiggy user.
I have used Zomato only a few times in my life,
I am so used to Swiggy delivering me on time, and its delivery guys not calling me to ask for direction that I hardly felt a need to jump onto to use Zomato. I am a Swiggy one (prime membership) user too.
The same is true for my childhood friend who is a hardcore Zomato user.
Does this mean that we have developed our preferences unknowingly because of the ecosystem Swiggy/Zomato have created around us?!
In this post, I will make an attempt to understand Zomato’s business operations, and carry out its fundamental valuation.
Note: I am not a registered advisor or agent. Anything I write in these posts are purely for your entertainment and educational purposes. Nothing in this post is an advice for you to make an investment or buy any stock. You are free to download the Excel and play around with it.
In my last post, I did a deep dive to understand a stock which went from trading at Rs 18 (its lowest) to ~Rs 95 (its highest) in around 4 years. You can read about it here.
Zomato was listed on Indian exchanges in July 2021.
Since then, it has seen its stock price go from Rs 125 (just after listing) to Rs 46 (its lowest) to Rs 192 (its highest).
I have recently read the news that Swiggy is planning to do an IPO. Let us see how the story evolves for Swiggy later, too. By then, We will have a lot more data on the market, which Swiggy and Zomato is going after. I think it is a well-known fact now that this market is going to be duopoly.
Anyway, let us try to understand how big is the market for food delivery and grocery, and how Zomato has performed over the course of the last few quarters.
Market Size
Zomato’s business can be broken down into 4 revenue sources:
Food Delivery : Delivery of food from restaurants
Quick Commerce : Grocery deliveries
Hyperpure : Deliveries of various commodities from farmers, producers, mills etc to restaurants
Going-out : Dining out business + events business
Based on the data available on Grocery market and Food+Grocery Market for India, I estimated the market size of food delivery business and grocery business segment separately.
However, The information and projection was given only till 2026.
The combined market (Food + Grocery) was projected to grow at a CAGR of 16.14% from 2024 to 2029. For Grocery only, the market was projected to grow at a CAGR of 19.24% for 2024 to 2029.
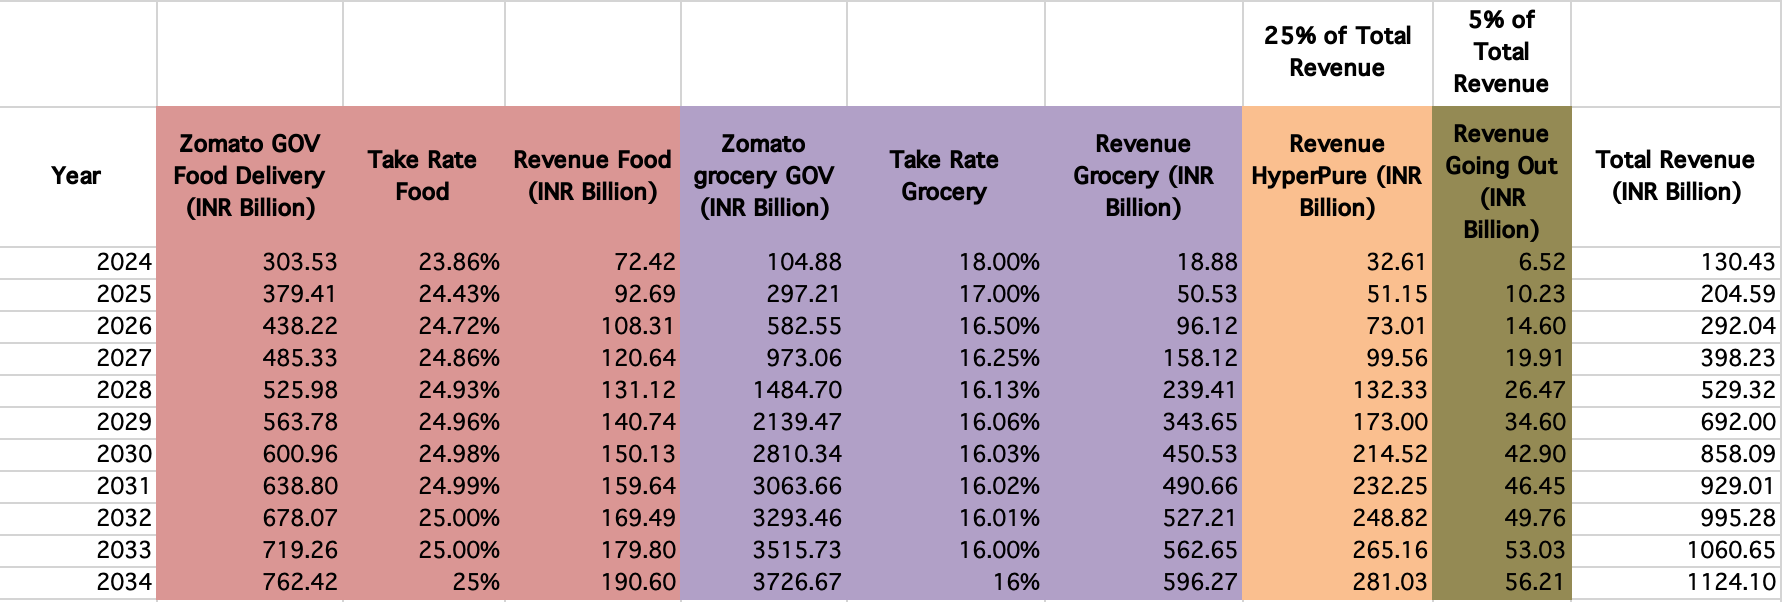
The difference in the market sizes thus obtained can be attributed to food delivery market (detailed calculation in Fig 1)
The “green” colored cells are calculated cells, and the “mustard” colored cells hold the information provided in the links above.
I assumed that the Food + Grocery growth will decrease from 16.14% to the risk-free rate of India i.e. 6% and the grocery growth will also decrease from 19.24% to 6%.
I think this is a fair assumption, given that estimation of market size beyond a 3-5 year period would become a mere conjecture. And, in the end, all markets would grow less than or equal to the Indian GDP growth rate.

Based on the current filing of Zomato, I calculated the trailing 12-month (TTM) GOV (Gross order value) for Food Delivery, and TTM GOV for Quick Commerce (Grocery) for Rs 303.53 INR Billion and Rs 104.88 INR Billion respectively. Check Fig 2.
(I apologize for making the cardinal sin of puttig Billions/millions infront of Rupee, However, bear with me 😅)
From Fig 1 data, I converted USD to INR at Rs 83 (The current exchange rate) to get rupee term market sizes in Fig 2.
These values give us the Zomato’s current market share of 27.9% and 4.12% respectively for Food Delivery and Grocery business (check Fig 2)
The combined market share of Zomato stood at 11.24%.

I assumed that Zomato will become 40% of the overall market by 2030.
I think it is a probable assumption. Swiggy could take the other 40%, and the rest might be of Zepto etc.
This is an assumption. Could I be wrong?
Well, most probably I will be wrong 😅.
But, let us proceed.
I assumed that Zomato’s market share increases linearly from 11.24% to 40% by 2030, and remains at this value thereafter (Last column Fig 2)
These increments will give me the “Total GOV” when I multiply the estimated Zomato market share (last column in Fig2) with Food+Grocery India market value of Fig 2 (Column 2 in Fig 2)
In the most recent earnings call, the CEO mentioned that the Food delivery business GOV could grow by 25% YOY. So for 2025, I assumed it to give me a value of Rs 379.41 INR Billion, a 25% increment over 2024 numbers.
The Zomato Market Share for 2025, based on our earlier linear increments, came out to be 16.03%, giving me Rs 676.62 INR Billion as Zomato Total GOV.
Since I know my 2025 Food GOV (post 25% increment), I can subtract these values to get the Grocery GOV for 2025.
I decreased the Food growth from 25% to 6% eventually by 2034.
Since at any year, I know the total GOV, I subtract the Food GOV from Total GOV, to give me Grocery GOV.
I also calculated the Grocery GOV growth per year. It is no surprise that it also decreased to 6% eventually.
This exercise gave me a complete picture of how Zomato’s food and grocery business could potentially pan out.
Operations Metrics
Food Delivery Business
If we look at Food Delivery business, we have two important parameters:
GOV (Gross Order Value): The total value of the order which is processed by Zomato’s platform. This is the price you pay when you check out of Zomato’s checkout window.
Adjusted Revenue: Defined as revenue from operations as per financials (+) actual customer delivery charges paid in the food delivery business (net of any discounts, including free delivery discounts on account of Zomato Gold program)


Over the span of these 9 quarters, the GOV has improved Quarter on Quarter basis at 5.14%, and adjusted revenue by 5.53%.
The take rate i.e. adjusted revenue/GOV has improved from Q3FY22 from around 21.82% to 23.86%. The take rate has been hovering in the 23-24% range for a few quarters now.
We will use this take rate as a base to calculate the revenue from GOV going ahead, and improve it to 25% by terminal year.
Quick Commerce (Grocery) Business
Here also, we have two parameters:
GOV: The total value of the order which is processed by Zomato’s platform. This is the price you pay when you check out of Zomato’s checkout window.
Revenue: Defined as Blinkit marketplace commission income (+) actual customer delivery charges (net of any discounts) (+) ad revenue (+) warehousing and ancillary services income.


Over the course of these 6 quarters, GOV has increased quarter-on-quarter at a rate of 20.24%, and the revenues by 25.60%.
The take-rate has increased from 13.99% to 18.18%. It has been stable at around this value since Q3FY23.
We will use this take rate as a base to calculate the revenue from GOV going ahead, however decrease it to around 16% value in terminal year.
The rational is as follows:
Dmart has a gross margin of around 15%
Zomato will be able to juice out more 1-2% more from advertisements etc
Going-out Business
The Going-out business is related to events, and dining out segment of Zomato.

The Going-out business is a miniscule segment in the Zomato Ecosystem. Its GOV contribution is currently just 0.07% of Total GOV, however, the revenue/total revenue ratio is around 2%.
For our analysis ahead, we will assume that this segment will continue to be small, and its revenue contribution will not be more than 5% in the long run.
Hyperpure Business
Hyperpure(HP) business of Zomato caters to primarily to the restaurants.
They define this segment as :
Hyperpure is our B2B supplies offering for restaurants in India. We source fresh, hygienic, quality ingredients and supplies directly from farmers, mills, producers and processors to supply to our restaurant partners, helping them make their supply chains more effective and predictable, while improving the overall quality of the food being served. Hyperpure solves multiple problems for restaurants by acting as a one stop solution for high-quality ingredients at competitive prices along with a reliable delivery service.
If we look at HP business’s financials, we can see that the contribution in revenue from this segment is increasing every quarter:
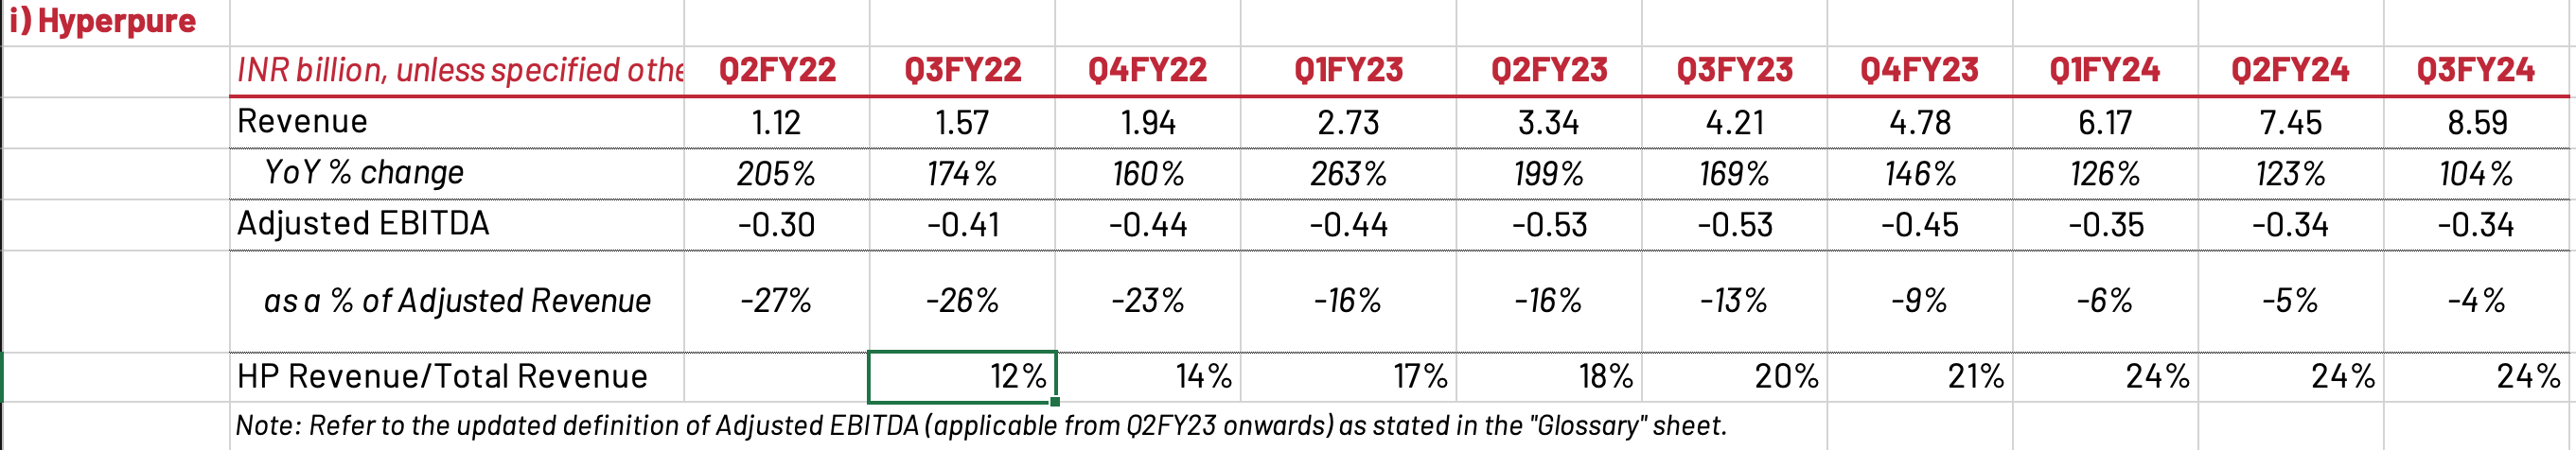
I will assume here that in the long run the contribution of HP to overall revenue will be around 25% (as is case).
Revenue Projections
Based on the discussion of market size and operation metrics, we can project the revenue as follows:
Valuation
Since we have a rough sense of how our revenues can pan out, we will now need to worry about:
What the long term operating margins would look like?
What reinvestments we need to take care of as revenues grow?
What the cost of capital would be?
What would the return on capital in terminal year to calculate reinvestment, since growth = reinvestment rate x return on capital?
For Operating margins, we will assume that the operating margins will improve to 25% from current -0.57%.
Why 25% you might ask? Well, it is an assumption and I did check what are the margins of profit making marketplaces in Statista. Check here.
We will use Prof. Aswath Damodaran’s Excel sheet to do valuation. It provides some good references to understand what sales-to-capital and cost of capital (though in dollar terms)
All growth comes at the cost of reinvestment.
Assuming Zomato to be in the category of Software (internet), the median sales-to-capital ratio for global stats for companies in this category is 1.52.
We will assume this to be the case for our 10-year period under consideration.
For cost of capital, we will assume that Zomato will fall under the 75th percentile range. The dollar value of cost of capital for software category is 10.97%.
We will need to convert this to rupee denominated cost of capital (COC). The rupee denominated value comes to 12.88%. (I have explained all the conversion etc in this post).
I will decrease this cost of capital to 10.5% in the terminal year (6% as risk-free rate of India + 4.5% mature market premium)
So, now, the only remaining point is for return on capital in terminal year. We have our terminal revenues growing at 6% forever, we need the return on capital to calculate the reinvestment rate in terminal year.
Since Zomato acts more like a platform, I went ahead to check what return on capital (ROC) is for such platform would be at:

I assumed that Zomato, with its vision, will be in the 75th percentile range. For developed markets the ROC/ROIC is around 13%. I scaled the ROC for India using the inflation rates (I have explained all the conversion etc in this post) to get 15% as stable terminal ROC.
Now, we have reinvestments, ROC, COC, and long term operating margins taken care of.
The only remaining things now are:
How do you handle employee stock options?
How to you accomodate the historic deferred losses or net operating losses?
Stock Options
The information I got from last annual report is the following:

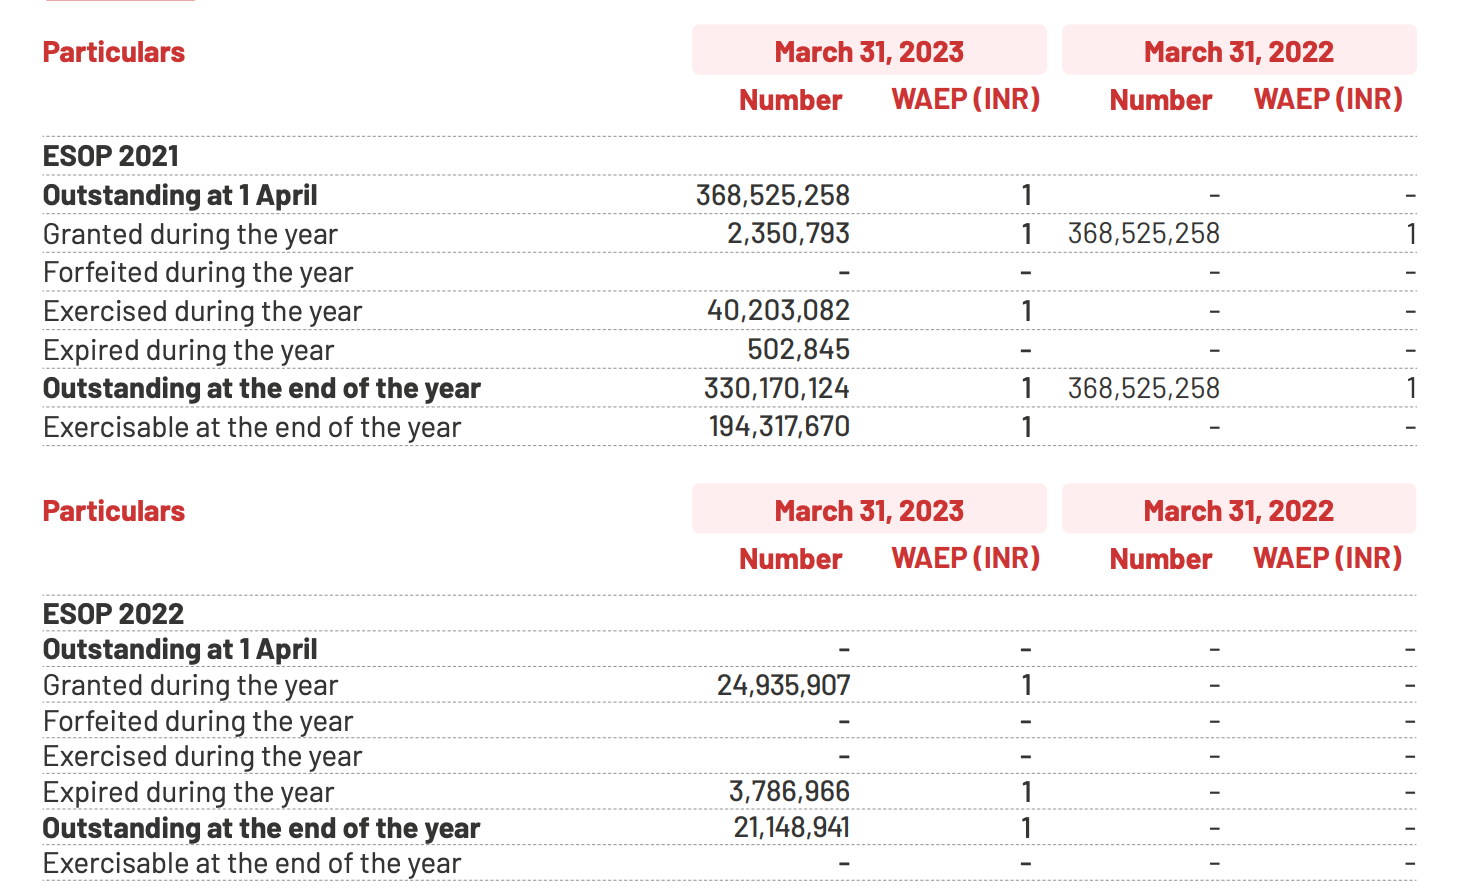

To calculate the ESOPs value using Black-Scholes model, I summed up all outstanding Esops giving me outstanding esops number as 351,352,338.
The average excercise price for all outstanding shares I got by multiplying the outstanding shares with WAEP and then dividig by all outstanding esops. This gives a value of Rs 1.69.
All options are “in the money” options.
We have expected volatility, risk-free interest rate i.e 6%, average life of options, and outstanding options (Check Fig 13)
The value of outstanding options comes out to be Rs 6565.50 crore.
(Please do let me know if you think the value is otherwise in comment section)
We will subtract this value from the value of equity and then divide by the number of outstanding common stocks to get the value of share. Check the attached excel at the bottom of post.
Net Operating Losses
The forwarded losses I considered in my valuation is as follows:
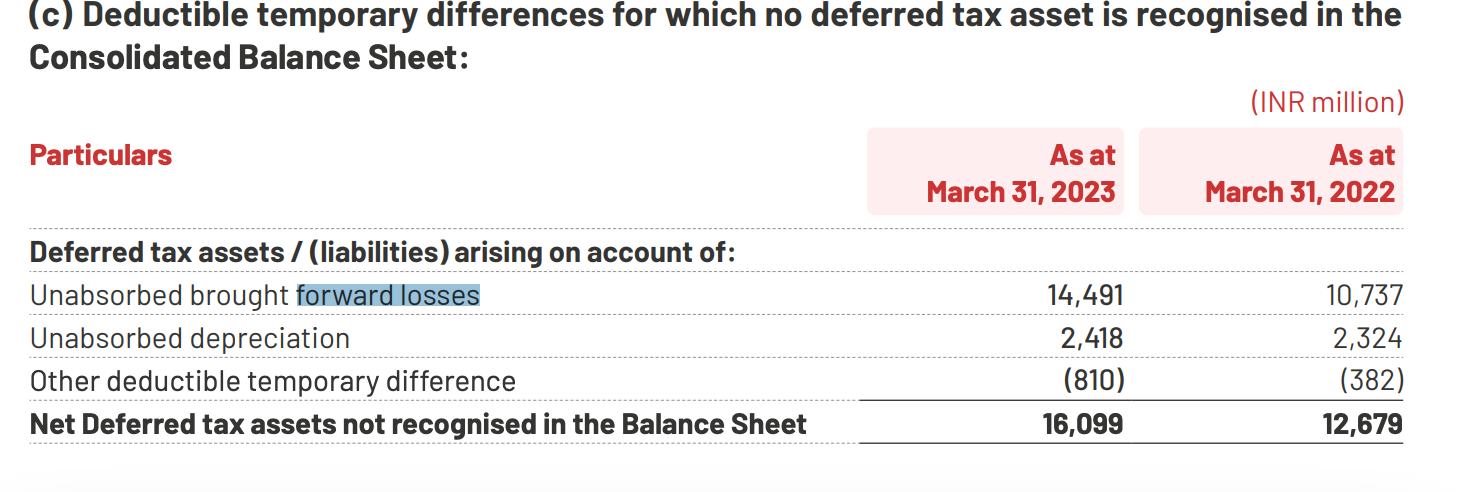
I used the value of Rs 1449.1 crore as the value of my Net Operating losses (NOL). This value cushions my estimated operating profits from being taxed on, till the NOL becomes 0.
Climax
The story we have woven so far looks like this so far:


Incorporating all the calculations so far 😮💨😮💨, we get the value per share around Rs 130.
The stock was trading at Rs 188.
The latest financial statement of Q4FY24 should come out soon. I will update my post accordingly based on new information provided.
I did a lot of detailed research for this post.I hope you liked reading it.
I could not explain everything in detail here though, unlike my previous posts. I apologize for that.
The post would have become too big to read.
LOL! (As if it isnt already)
Thank you for your valuable time.
I hope you have enjoyed my story. Please go ahead and make yours too.
Here is the excel sheet.
You can play around with the following tabs:
Input Sheet
Zomato Data
Market Size
Valuation output
Stories to Number
Option Value
See you next post.